
The map and its settings
The map every analysis view sits on, the chips around it, and each setting that changes how your track is drawn.
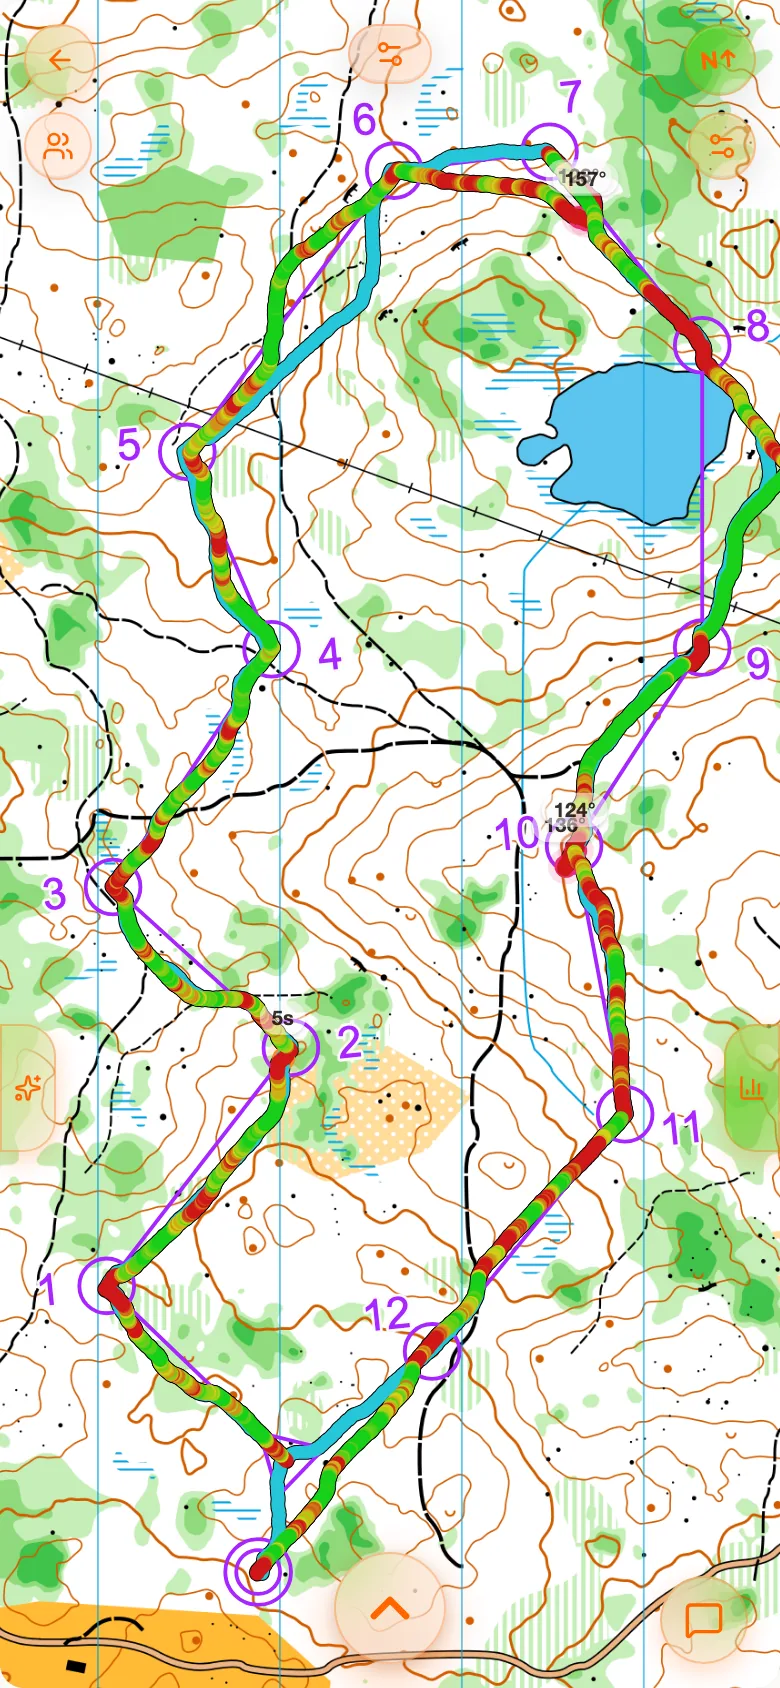
An analysis opens on the map and nothing else. Everything you can change sits in small chips on its edges, so the map keeps the whole screen until you ask for something.
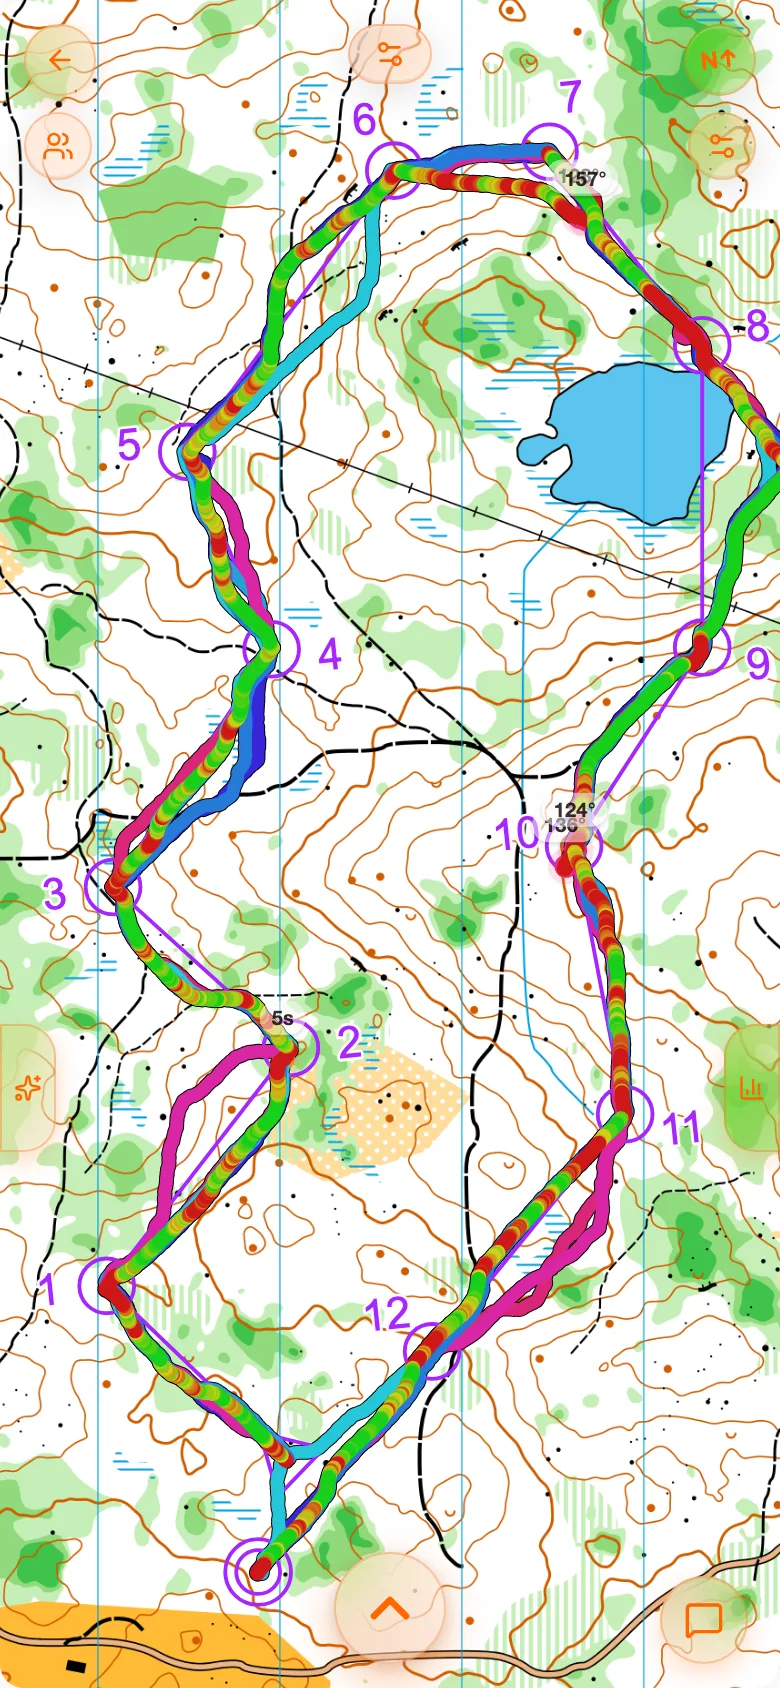
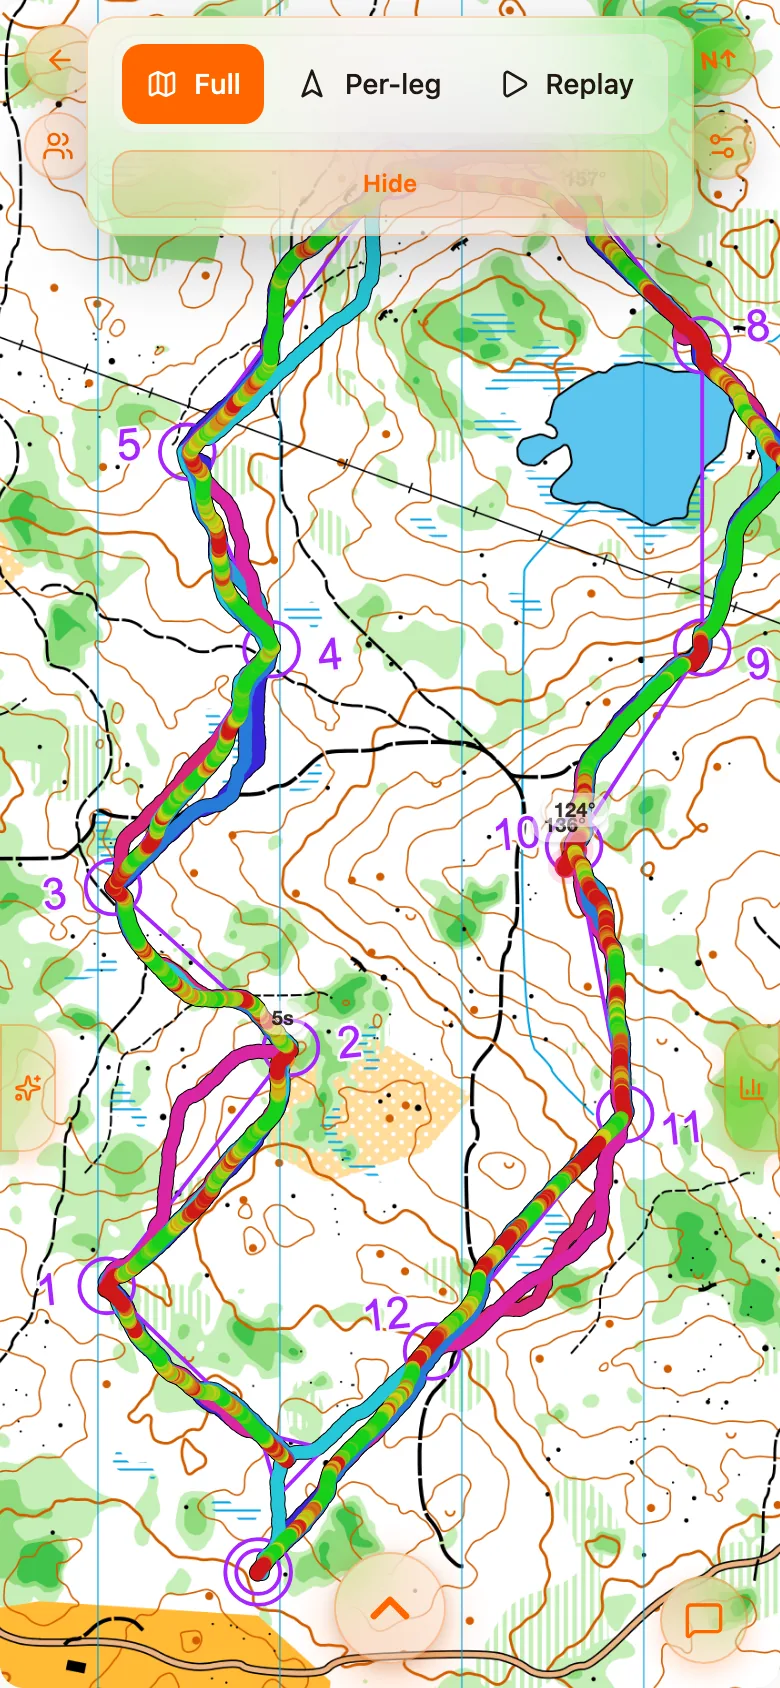
The controls around the map
| Control | Where | What it does |
|---|---|---|
| Open toolbar | Top | Switches between Full, Per-leg and Replay. Hide closes it and gives the map back. See Full course, Per-leg and Replay. |
| Open runners | Left edge | The field panel: pick whose tracks to show next to yours. |
| Open map settings | Right edge | How your track and the others are drawn, for this analysis only. |
| North | Corner | A compass that shows how far the map is turned. Tap it to turn the map back to north. |
| Show analysis charts | Bottom | Pulls up the sheet with mistakes, performance and terrain. See Mistakes, performance and terrain. |
| Open field comparison | Bottom | Your race against the class. Only on events with split times. See Split times. |
| Open AI summary | Bottom | The AI coach's review. See The AI coach. |
| Back to event | Top | Leaves the analysis for the event page. |
The chips float above the map on translucent glass instead of sitting in a bar around it. The map is the product, and the controls take no space from it.
Other runners
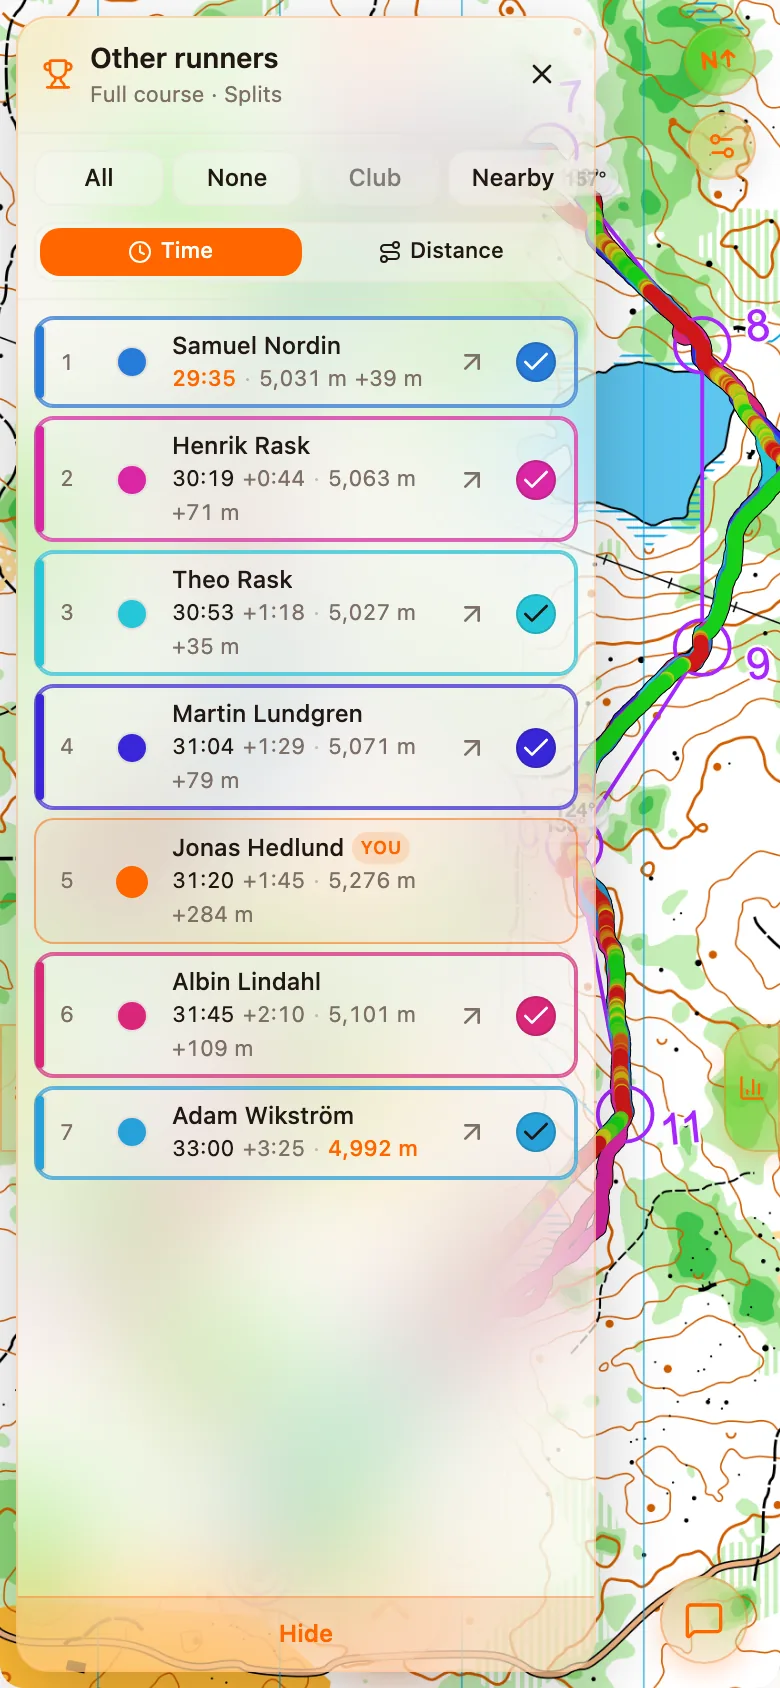
Tap a runner to put their track on your map, or use the row above the list to pick All, None, your Club or the runners who finished Nearby you. The list sorts by Time or Distance, and Change color on a row picks that runner's colour. Your own row carries a YOU tag. A runner whose owner has not shared a track does not appear on the map; see Privacy.
Map settings
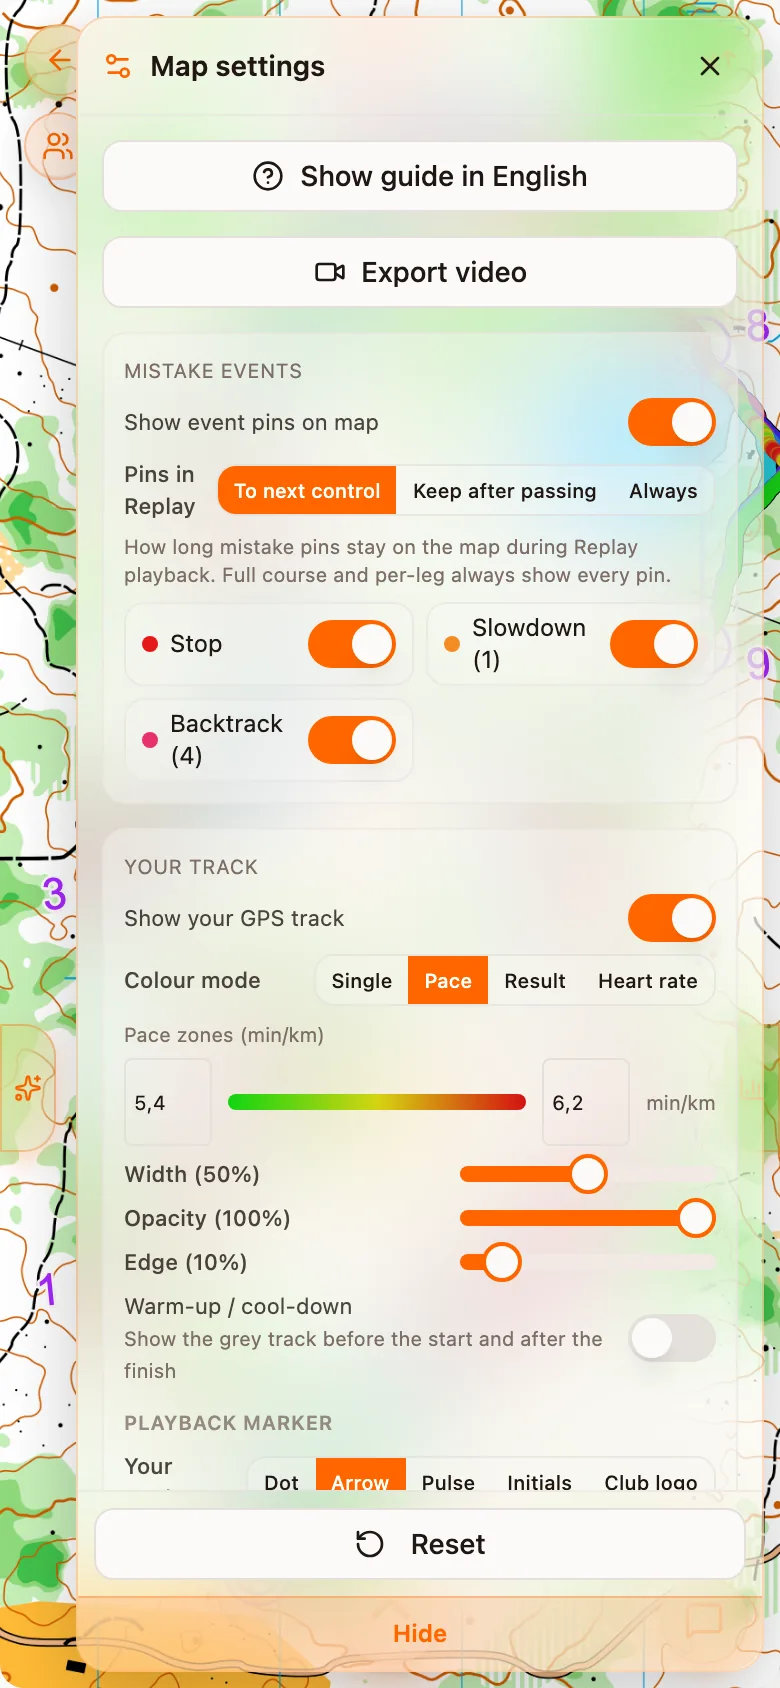
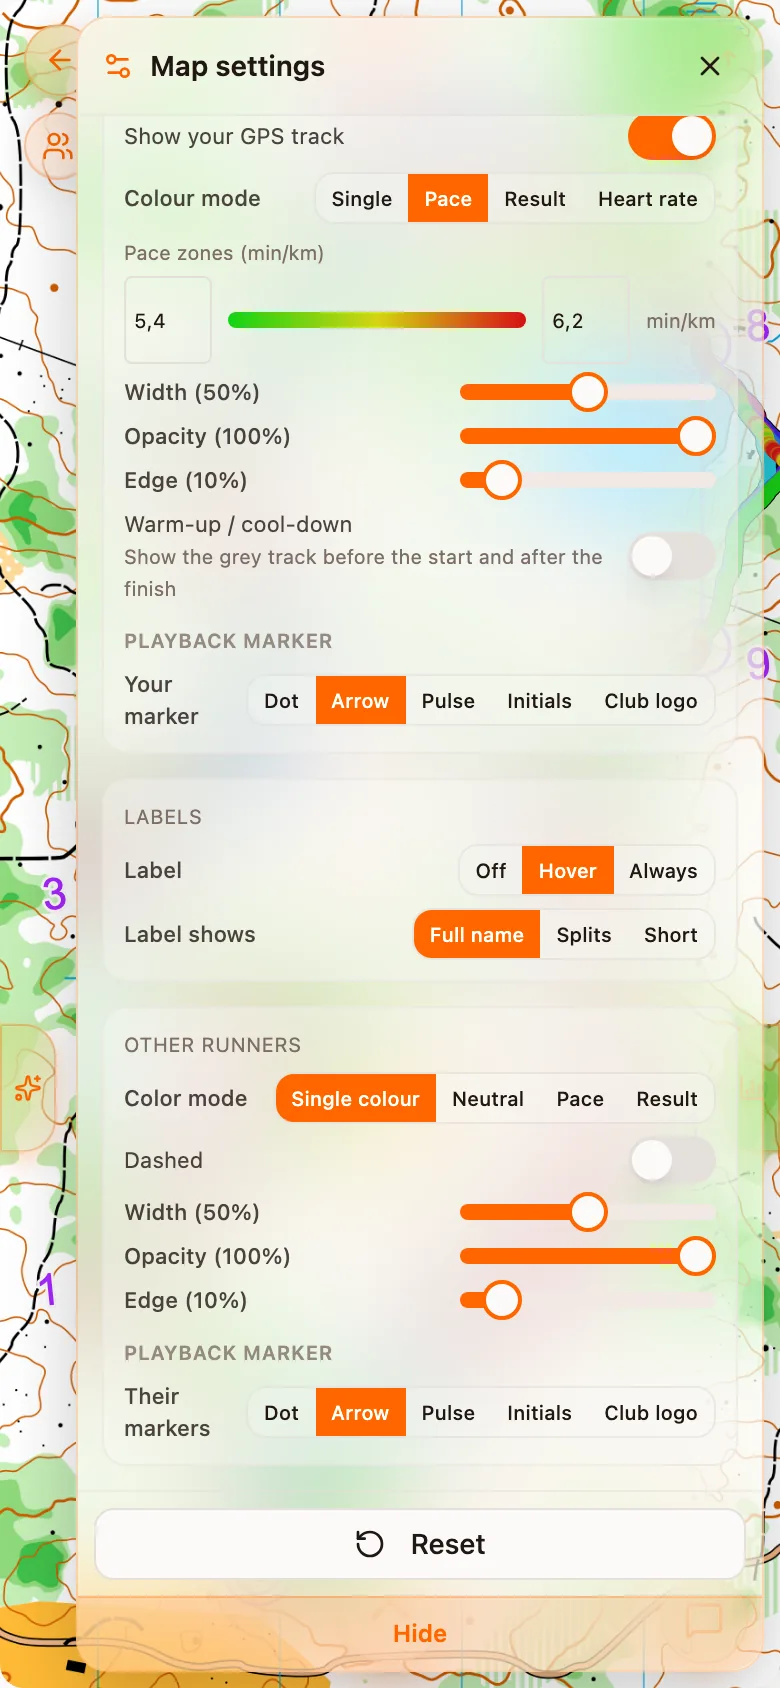
The sheet is a set of groups. A change applies to this analysis only; your standing defaults live in Settings. Reset at the bottom puts the sheet back to those defaults.
| Group | What you can set |
|---|---|
| Mistake events | Show event pins on map and which kinds to show: Stop, Slowdown and Backtrack, each with its count. Pins in Replay sets how long a pin stays during playback: To next control, Keep after passing or Always. Full course and per-leg always show every pin. |
| Your track | Show your GPS track, and the Colour mode: Single, Pace, Result or Heart rate. Under Pace you set the two ends of the Pace zones (min/km). Then Width, Opacity and Edge, and Warm-up / cool-down, which draws the grey track before the start and after the finish. |
| Playback marker | The marker that moves in Replay: Dot, Arrow, Pulse, Initials or Club logo. Yours, and separately the other runners'. |
| Labels | Off, on Hover or Always, showing Full name, Splits or a Short form. |
| Other runners | Color mode: Single colour, Neutral, Pace or Result. Dashed, and the same width, opacity and edge sliders. |
Result colour uses the field's scale
Export video at the top of the sheet makes a video of the replay; see Replay.
Extra map layers
When an organiser has added more maps to an event, a layer chip appears and switches between the primary map and the others. Each layer is georeferenced separately, and can be drawn on top of the primary map with adjustable opacity. See Advanced maps.
How the map is drawn
- Everything happens in map pixels. GPS points are projected into the image's own pixel space once, and every later calculation (leg splitting, deviation, mistake positions, shortest paths) happens there. An orienteering map is a local, hand-made reading of the ground, not a projection of the globe, and it is not aligned to true north. The one-time conversion is the georeference; see Georeferencing.
- Course symbols scale with the map. Controls, start, finish and leg lines are drawn in map units, so they grow and shrink with the zoom like printed ones.
- The overprint is the sport's purple. The IOF colour appendix defines it, and a competitor reading a course expects that ink. Control numbers are set in Arial, which the IOF map specification prescribes. It is the one place Analyse departs from its own typeface.
- Rotation. In per-leg view the map turns by itself so the leg points upwards. In full course, and in Replay's free camera, you turn it yourself by twisting two fingers, or with Ctrl or Shift and drag on a computer. Your touch is rotated with it, so dragging down moves the map down on the screen at any angle.
Reviewing in the terrain
Large maps
A 300 dpi render of an A3 map is a large image, and some browsers refuse to decode one past a certain size. Analyse detects that and draws a downscaled preview, so an oversized map is slower and slightly softer instead of blank. Map images are cached on your device after the first load, so an analysis you have opened before does not download its map again.