Full course
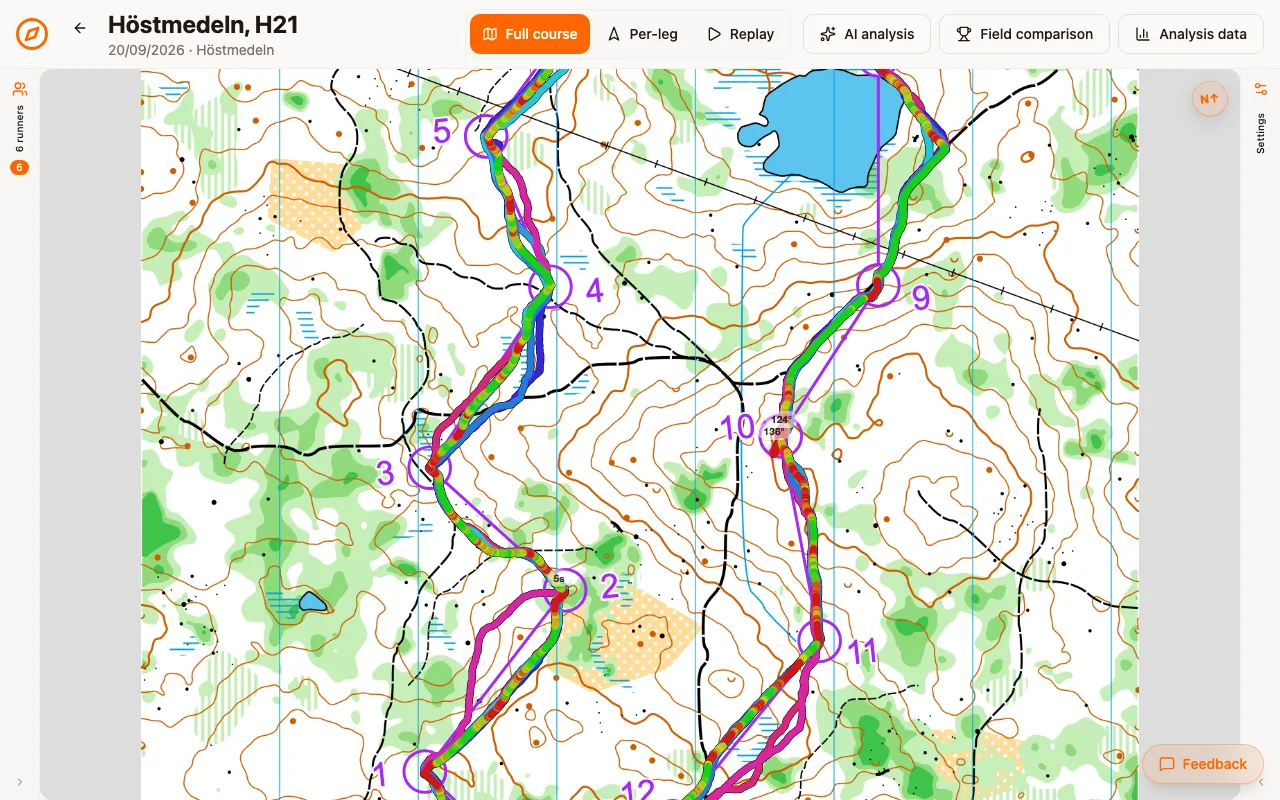
The whole race on the real map: your track, the other runners, and the sheets that hold the numbers.
Full course draws the whole map, the whole course and your complete track at once. A run opens on it. It is the view for questions about the race as a whole: where the long legs were, which stretches of terrain were hard, and whether your mistakes cluster anywhere. For one decision at a time use per-leg; to watch the race unfold against the field use replay.
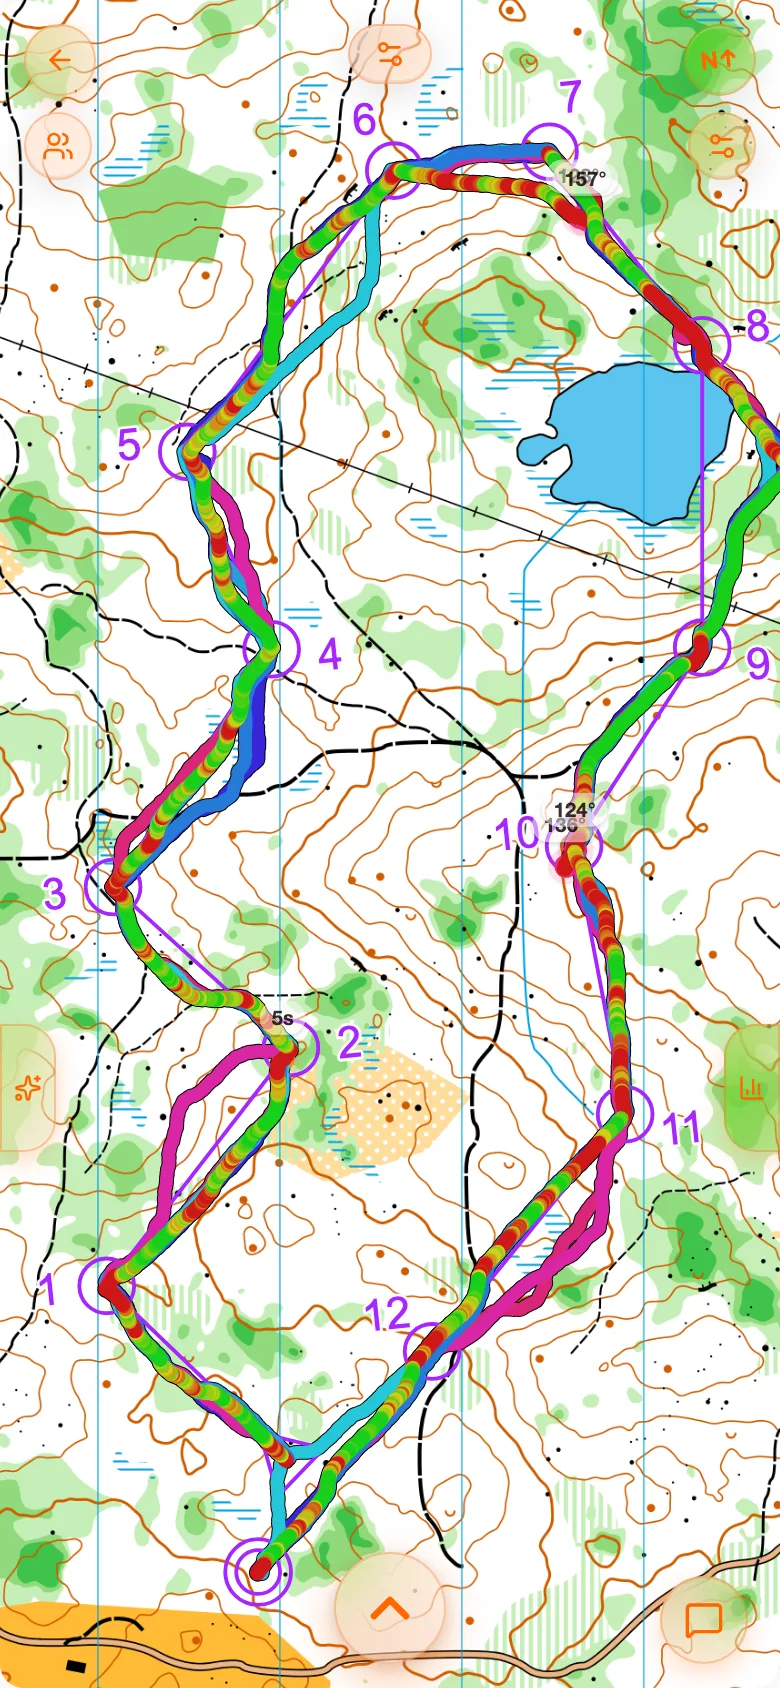
The controls around the map
| Control | What it does |
|---|---|
| Open toolbar | The pill at the top. Opens the switcher between Full, Per-leg and Replay. Hide closes it again. |
| Back to event | The arrow at the top left. Back to the event page. |
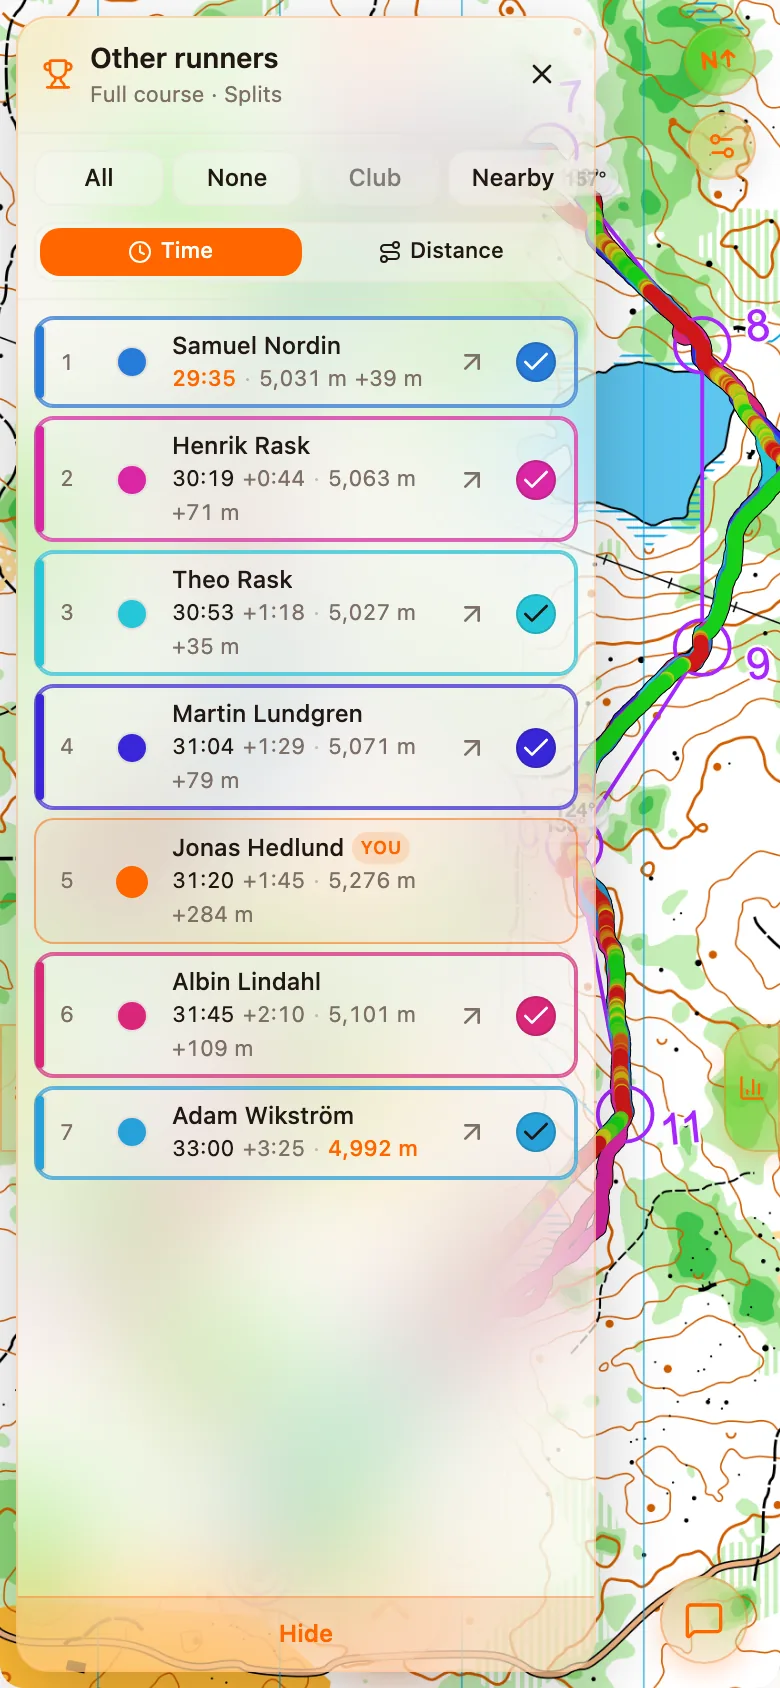
| Open runners | Under the arrow. The other runners of your class: tap one to draw their track. |
| North | At the top right. Turn the map with a two-finger twist (Ctrl or Shift and drag on a computer); this button turns it back to north up. |
| Open map settings | Under North. How your track is coloured, which pins show, labels and markers. |
| Open AI summary | The chip on the left edge, or swipe in from the left. See The AI coach. |
| Open field comparison | The chip on the right edge, or swipe in from the right. It appears when the event has split times. |
| Show analysis charts | The big arrow at the bottom, or swipe up. The sheet with the mistakes, the charts and the terrain. |
Reading your track
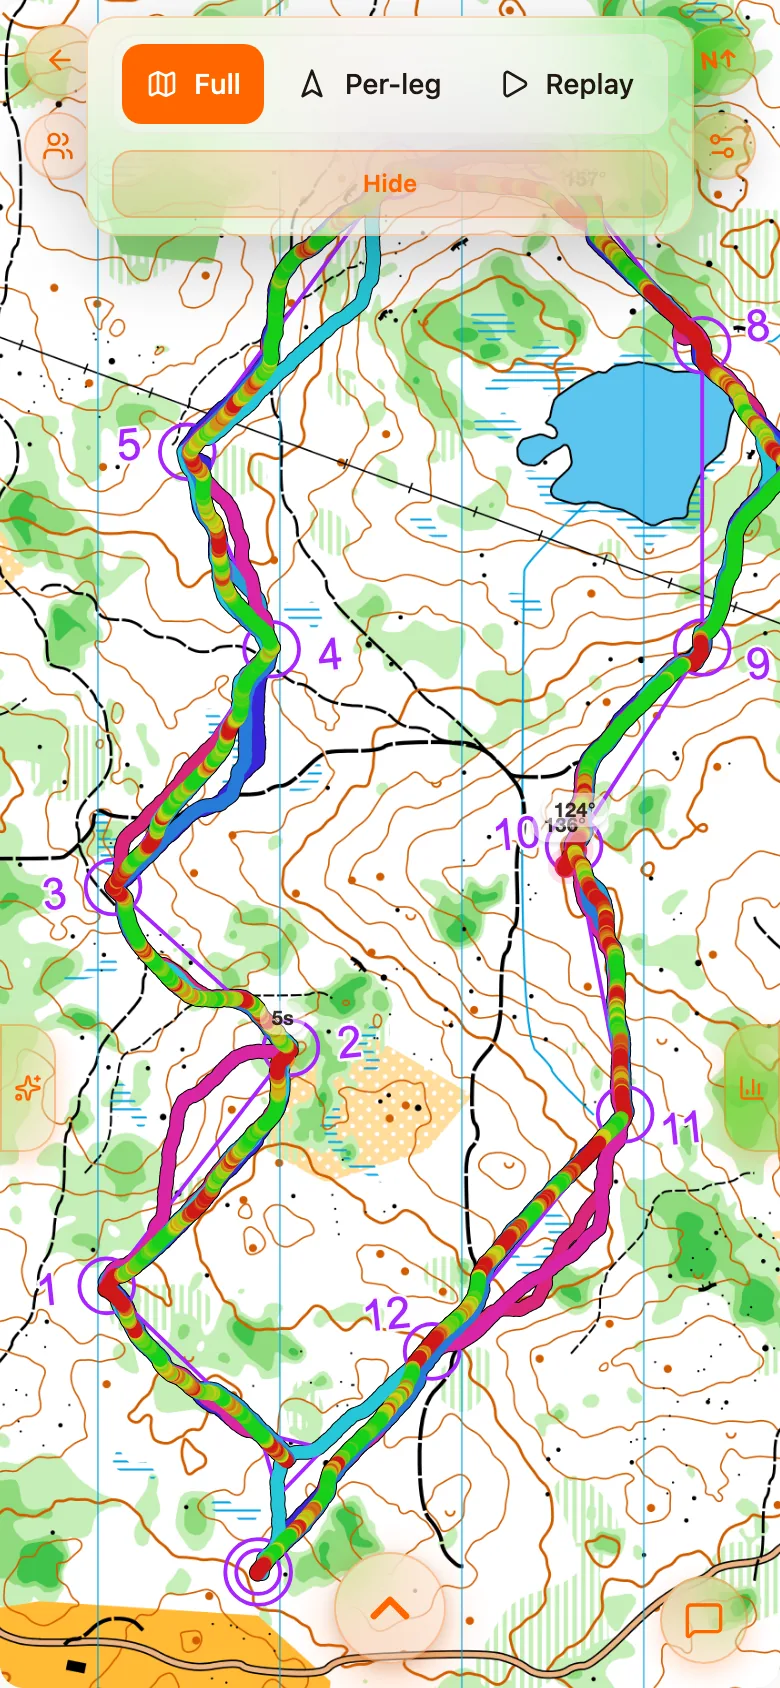
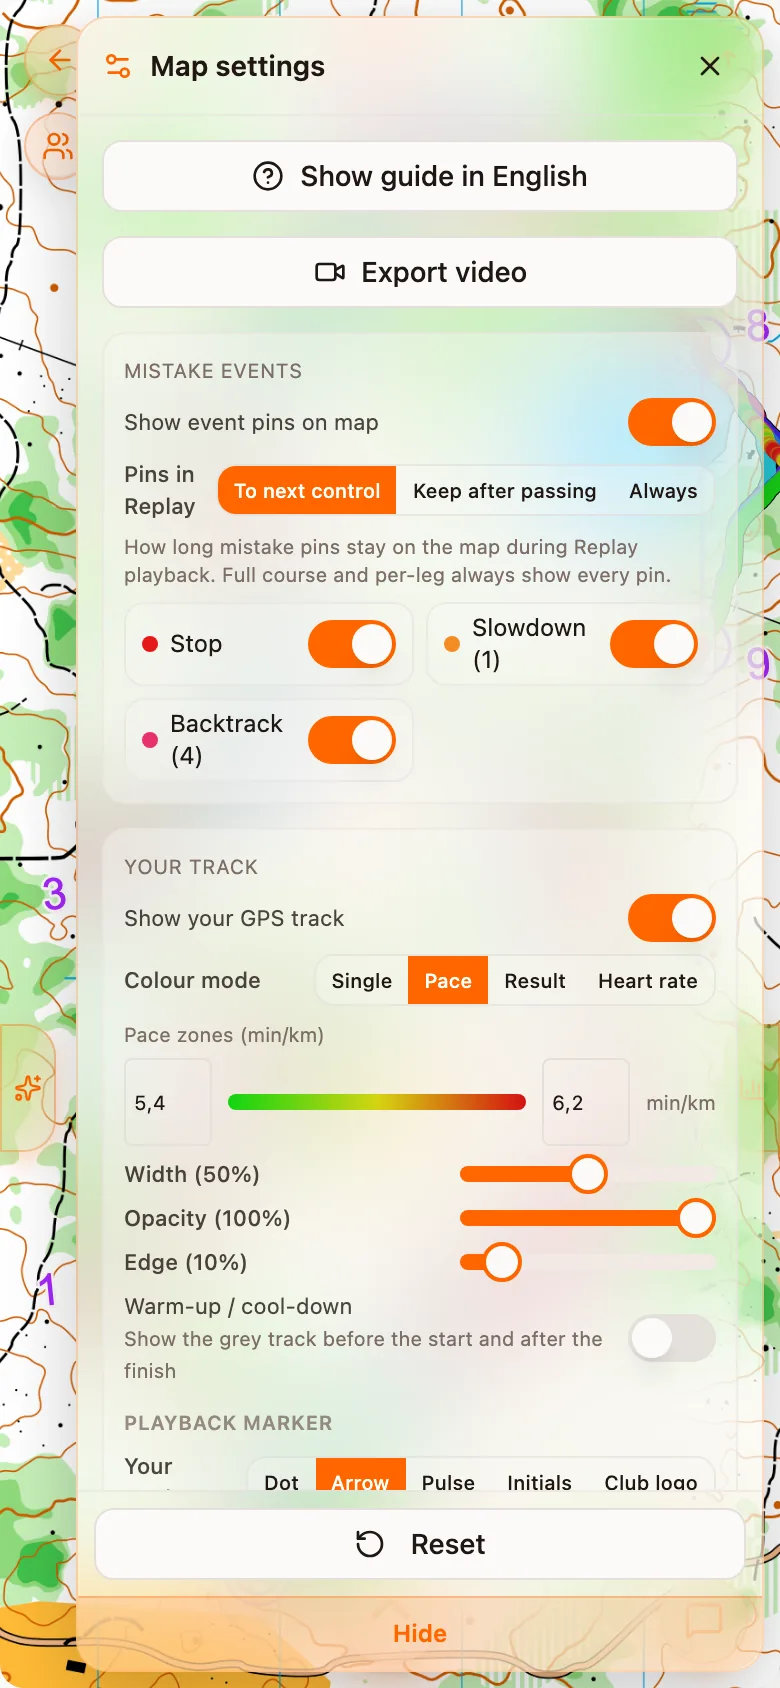
By default the track is coloured by pace, green where you were fast and red where you were slow, between two pace limits you can change. Under Open map settings the Colour mode can also be Single (one colour), Result (your track on the same result scale as the other runners) or Heart rate. Other runners have a colour mode of their own: a colour each, neutral, pace or result.
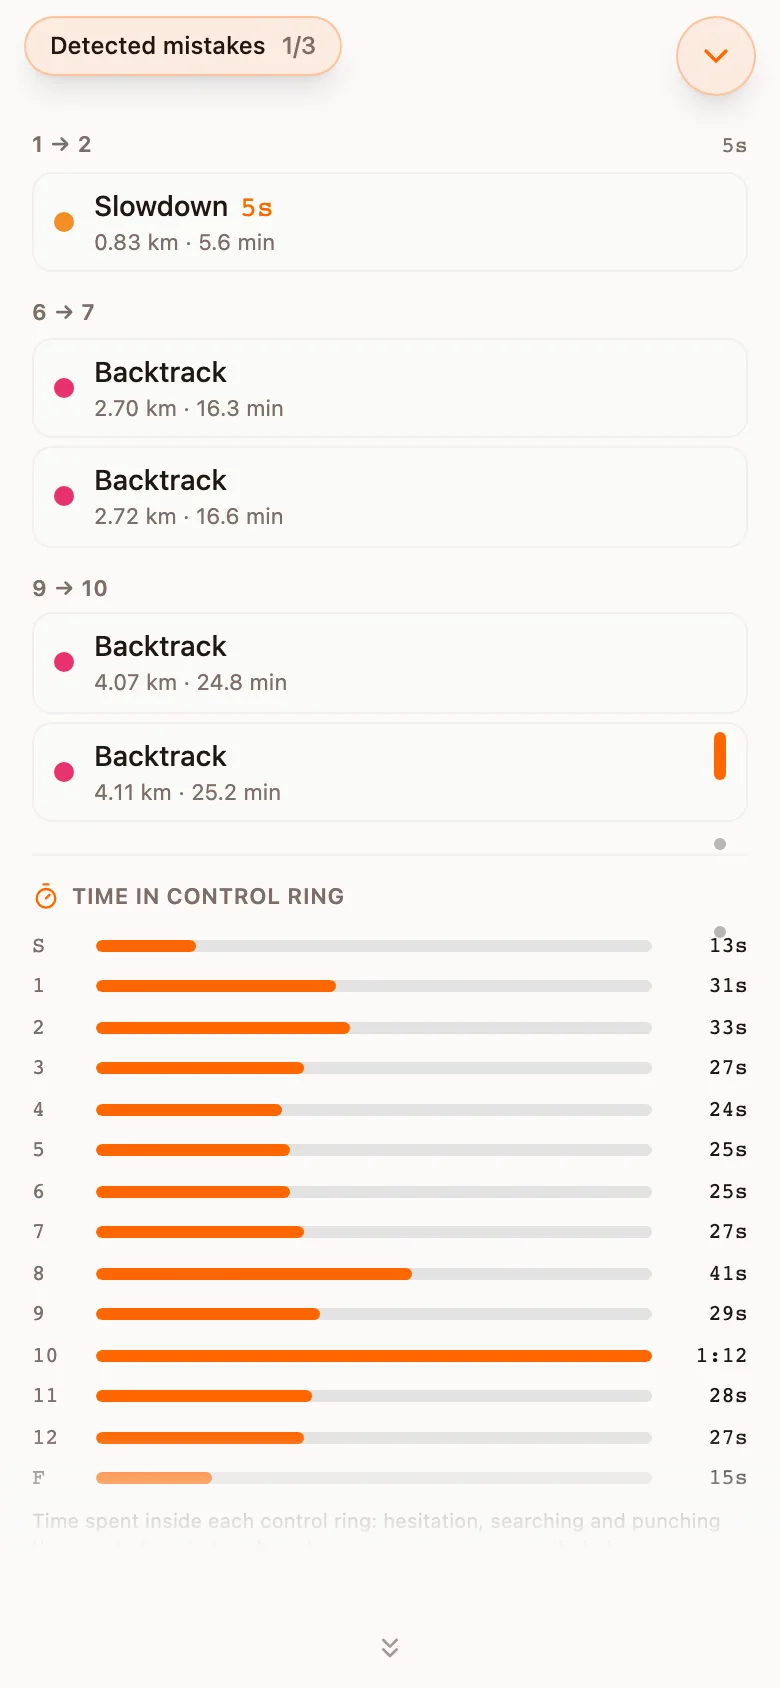
The pins on the track are the mistakes the detector found: Stop, Slowdown and Backtrack. Full course always shows every pin. Turn them off with Show event pins on map, or switch off a kind you do not want. What each one means, and what is not counted, is on Mistakes, performance and terrain.
The sheet underneath
Pull up the arrow at the bottom for the numbers behind the map. The sheet has one section at a time, and scrolling past the end of one brings the next:
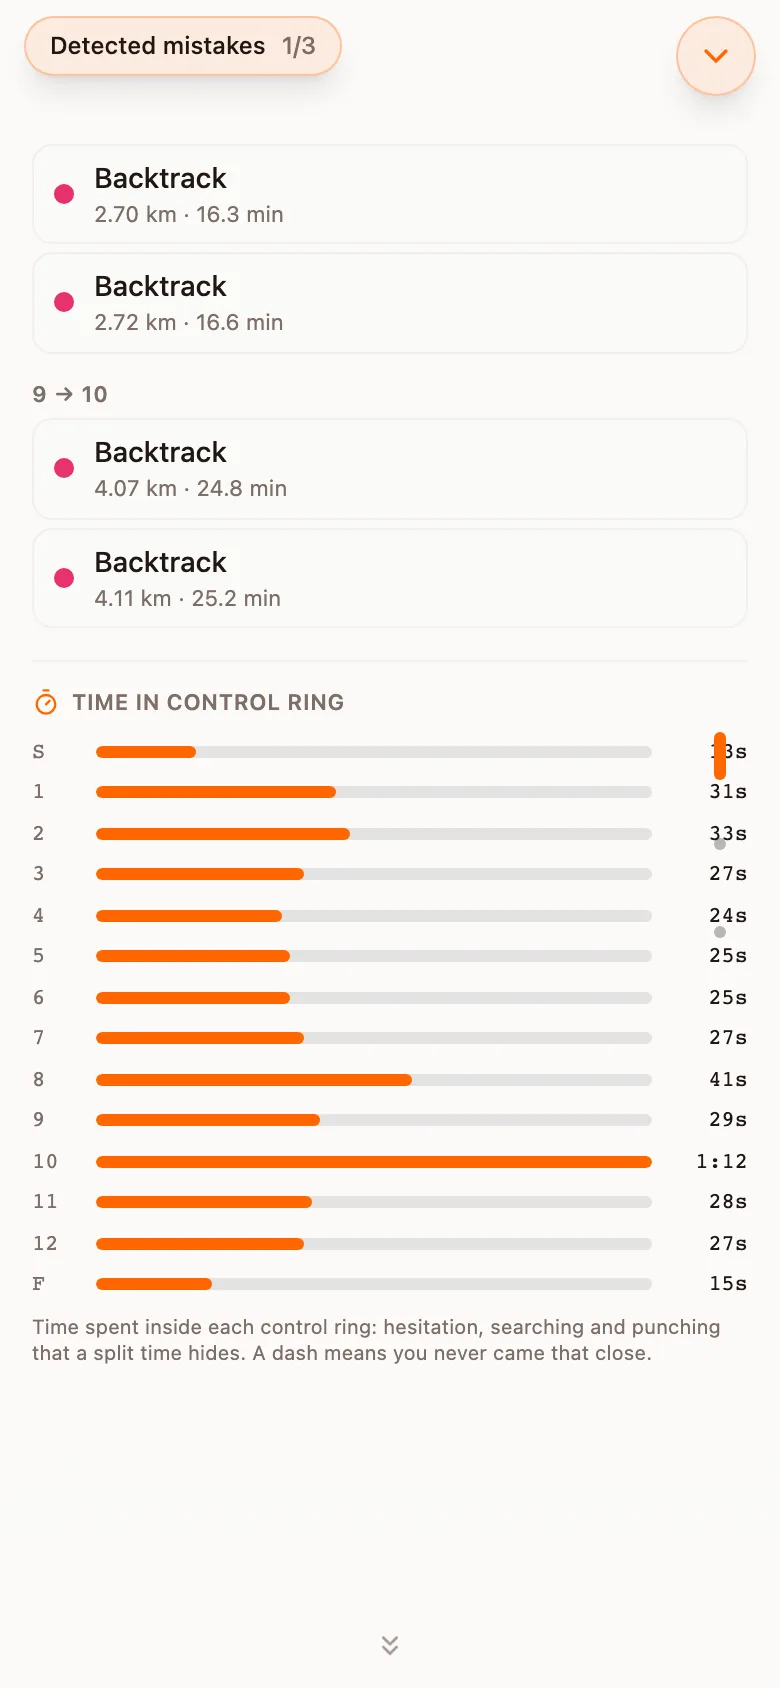
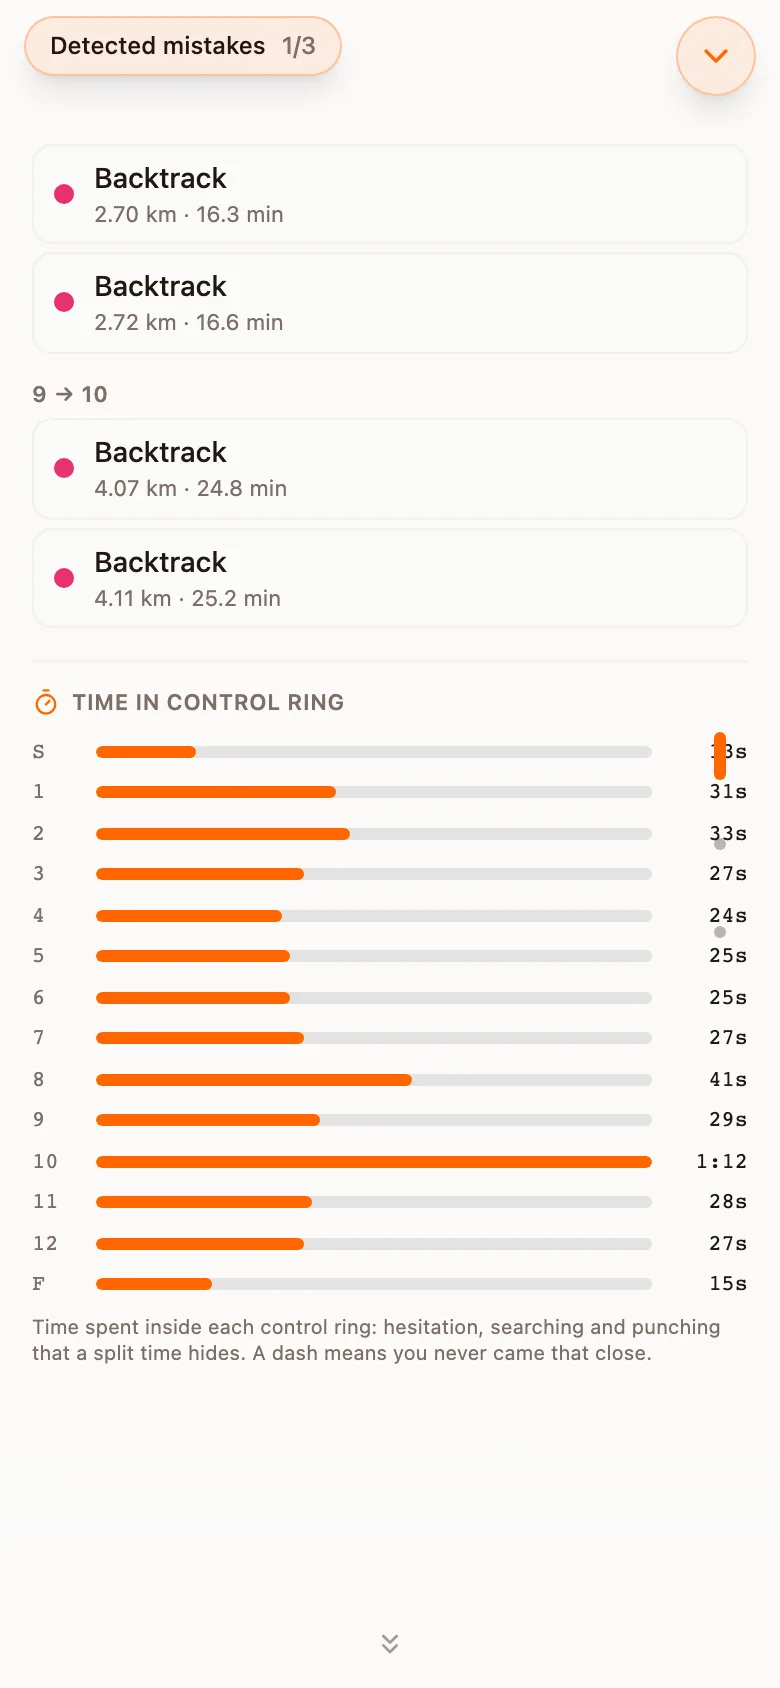
- Detected mistakes, listed leg by leg, and below them Time in control ring.
- Performance: pace, heart rate and elevation along the race.
- Terrain breakdown: how far you ran on each kind of ground, and how fast.
- Leg comparison, a table of every leg. It is in the sheet on a computer, and on a phone when the event has no split times, since the field comparison covers it otherwise.
Warm-up and cool-down
A watch usually starts in the car park and ends after a jog back. Analyse finds the race portion of the file and treats everything outside it as warm-up and cool-down: left out of the statistics and of the mistake detection, and hidden on the map. To see it as a grey track, switch on Warm-up / cool-down in map settings.
On a computer