
Routster Analyse
Upload the GPS track from a race and find out where the time actually went.
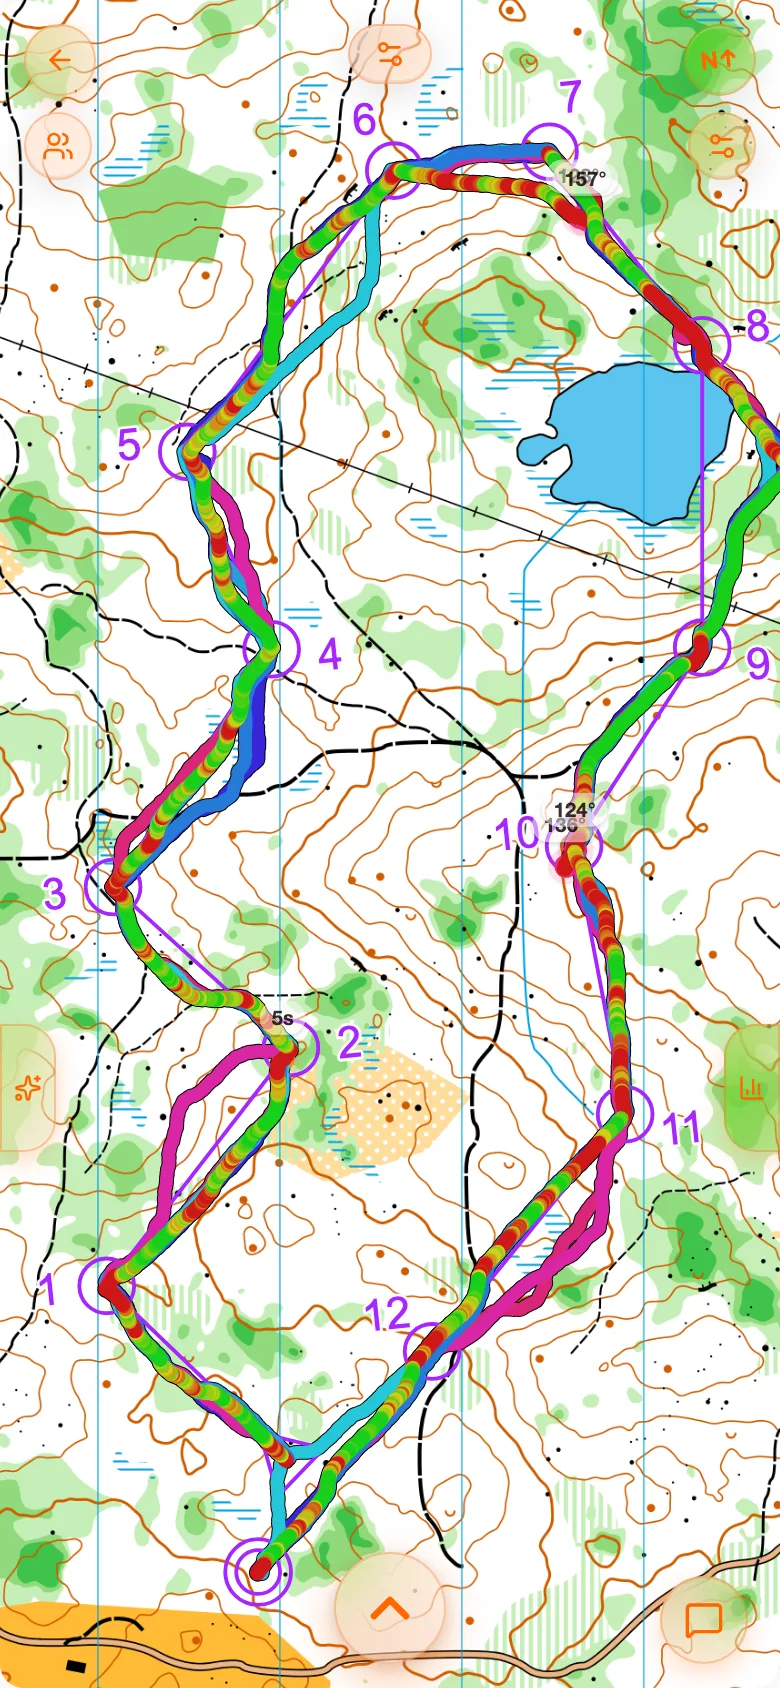
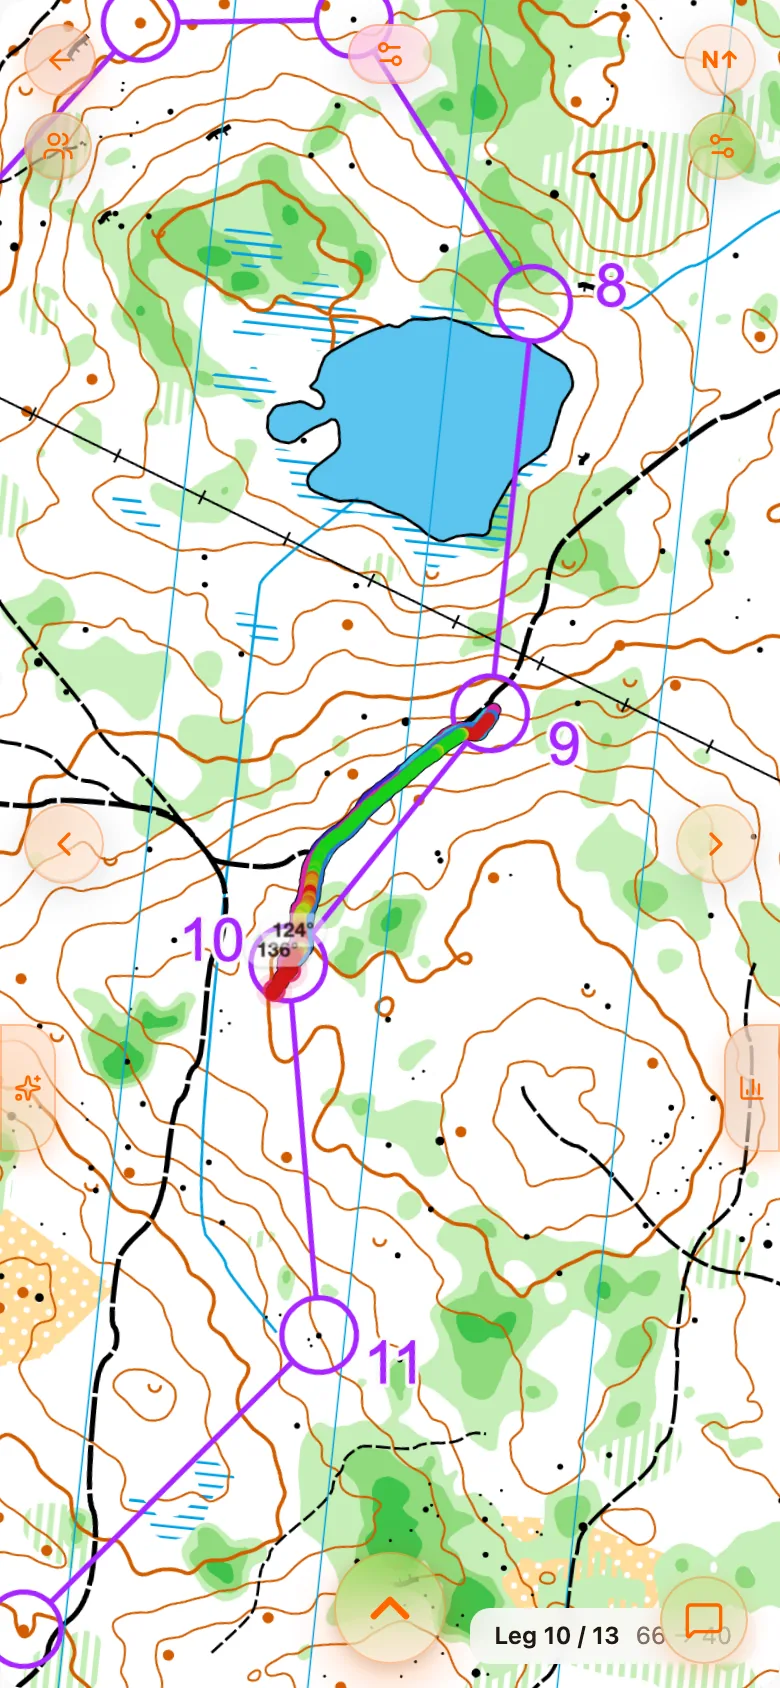
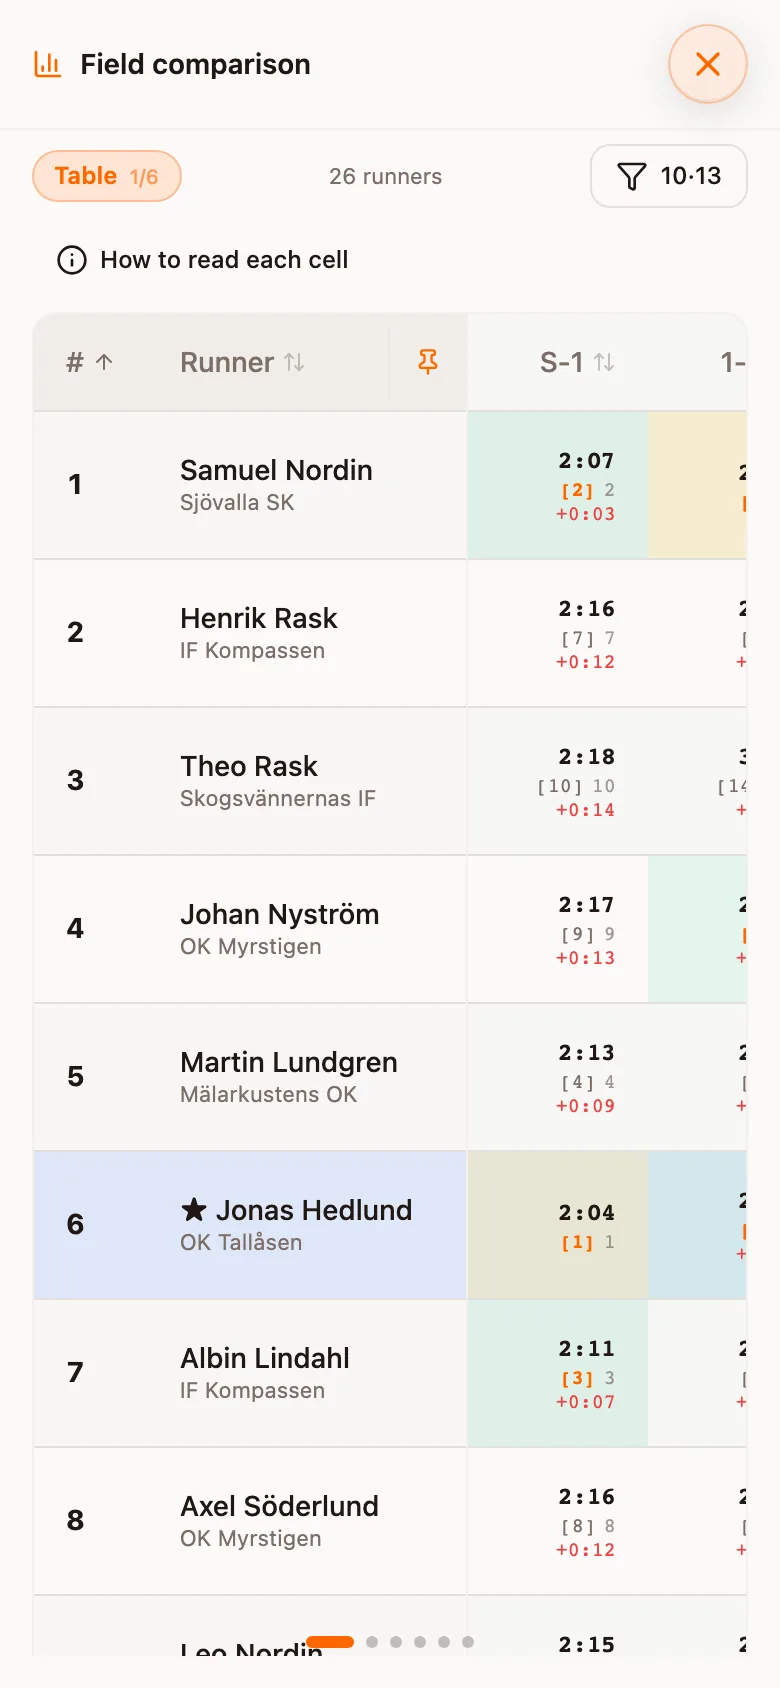
Analyse puts three things in the same coordinate system: the orienteering map, the course and your GPS track. From that it works out which leg you were on at every moment, where you stopped or doubled back, what ground you ran on, and how each leg compares with everyone else in your class.
Phone first
From the finish to your analysis
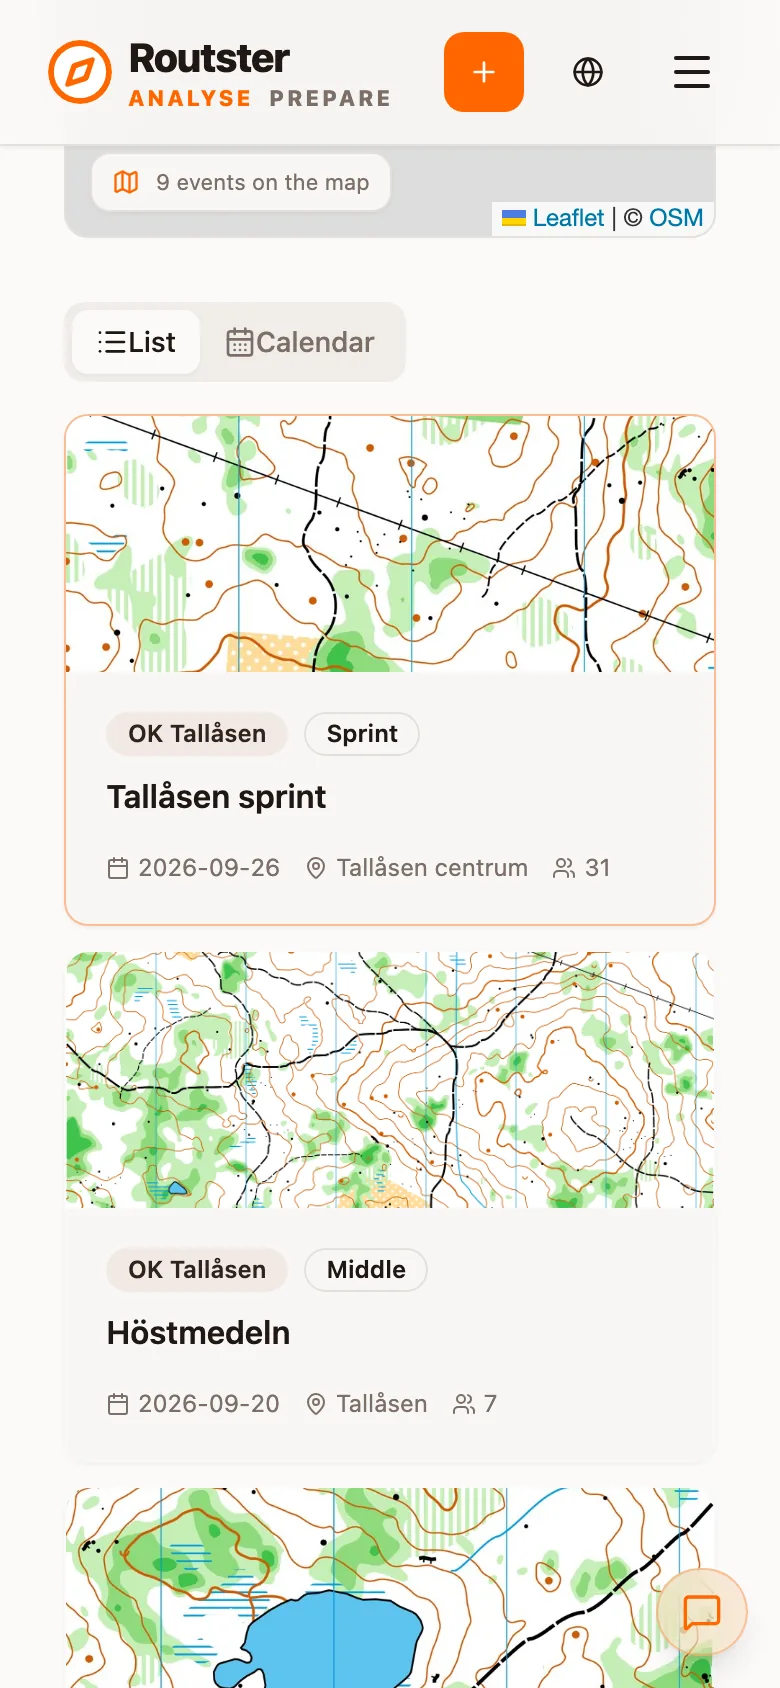
Step 1. Find or create the event
Every analysis belongs to an event. Open Events and pick the race, or create your own training with Create event. A race its organiser has published already has the map, the course and the results.
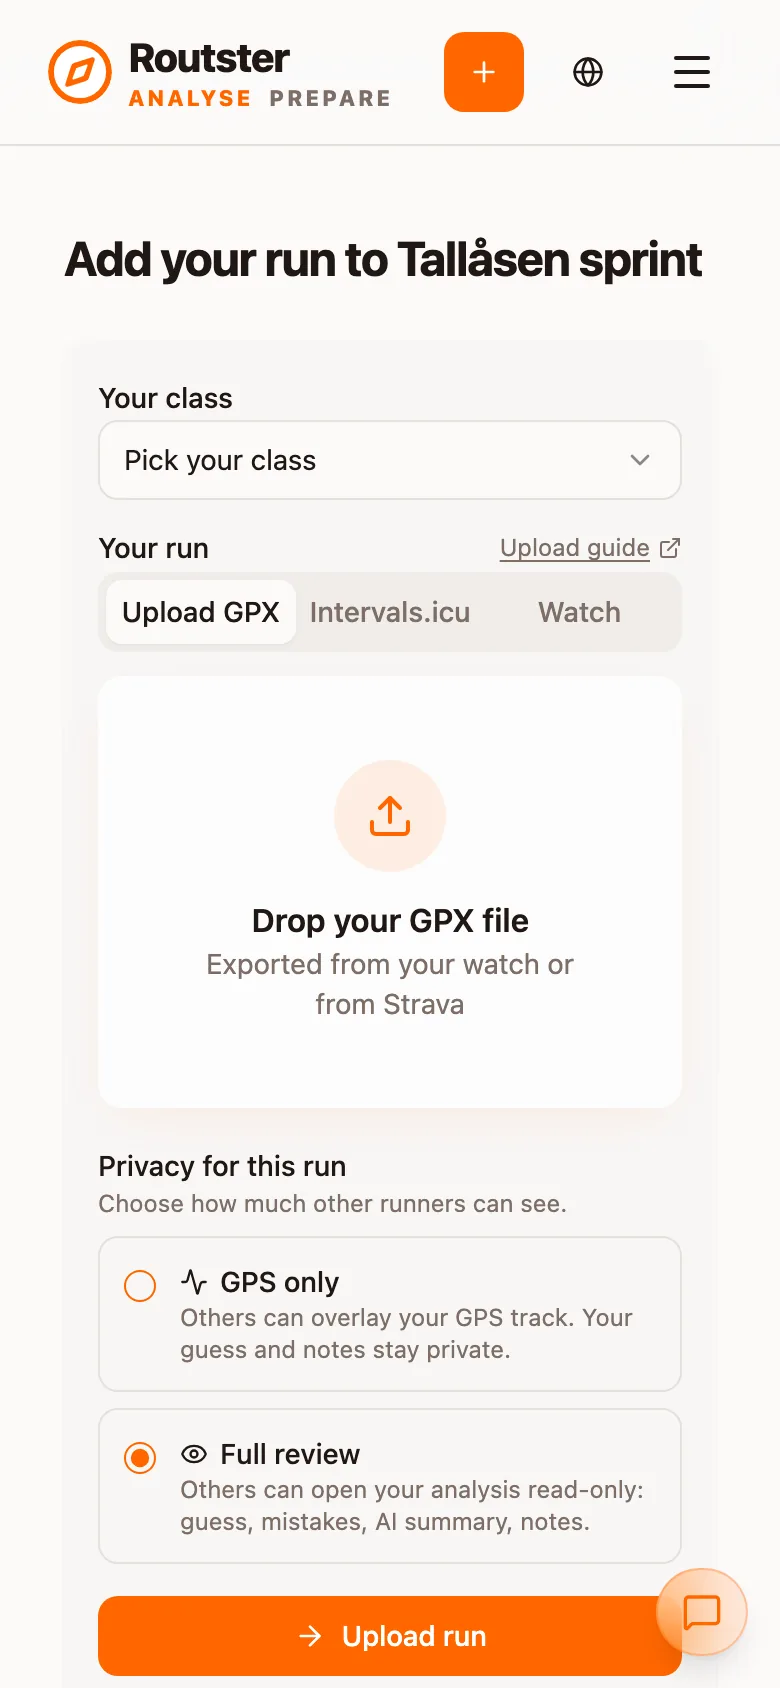
Step 2. Add your run
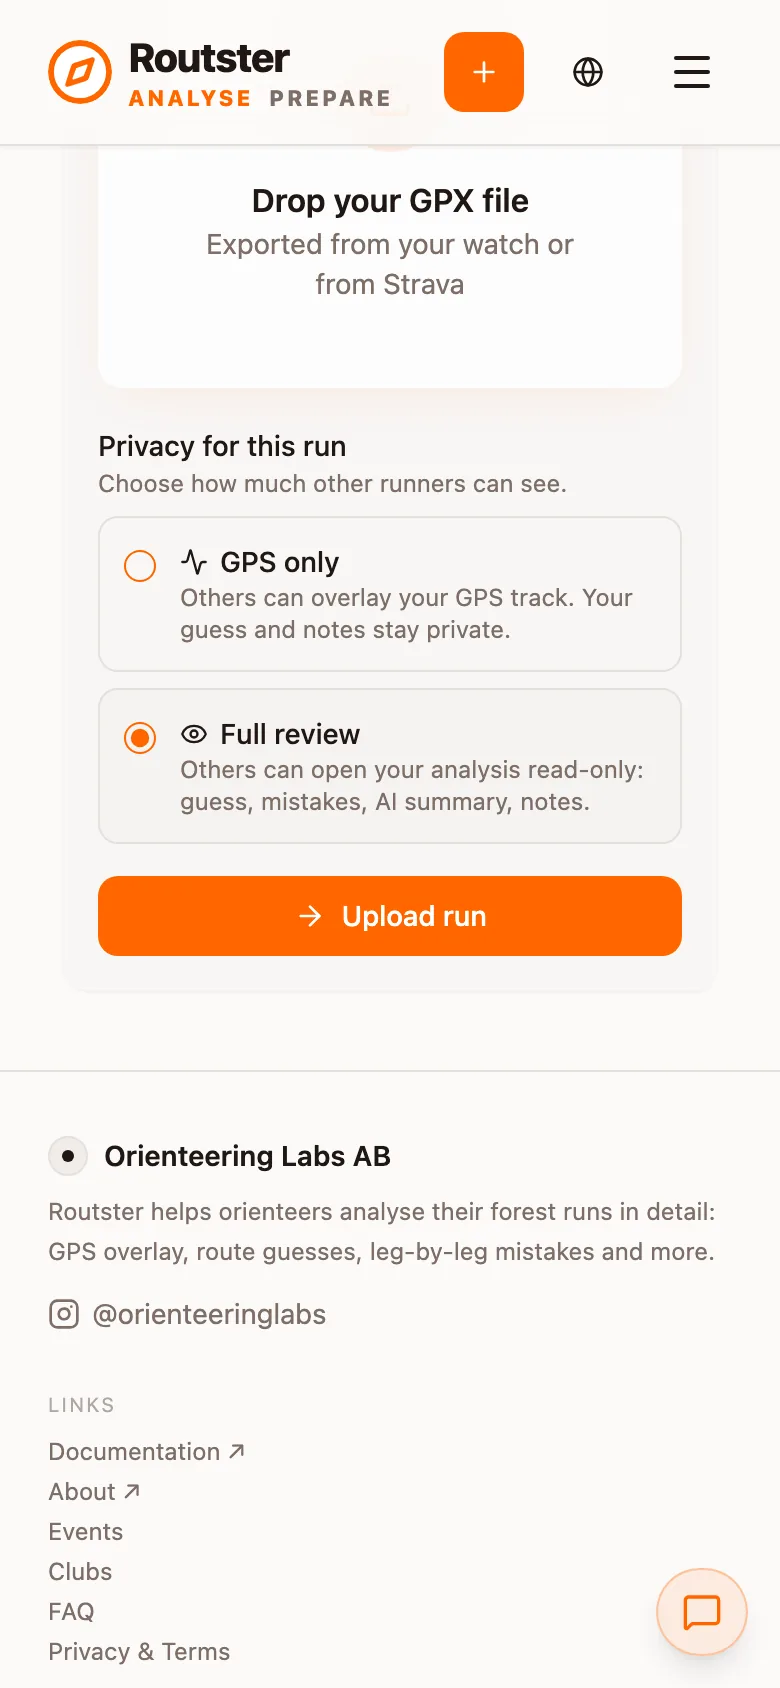
Open the event and press Add my run. Choose your class, bring the track with Upload GPX, Intervals.icu or Watch, and choose what others may see: GPS only or Full review. Uploading your GPX takes each way in turn.
Step 3. Read the analysis
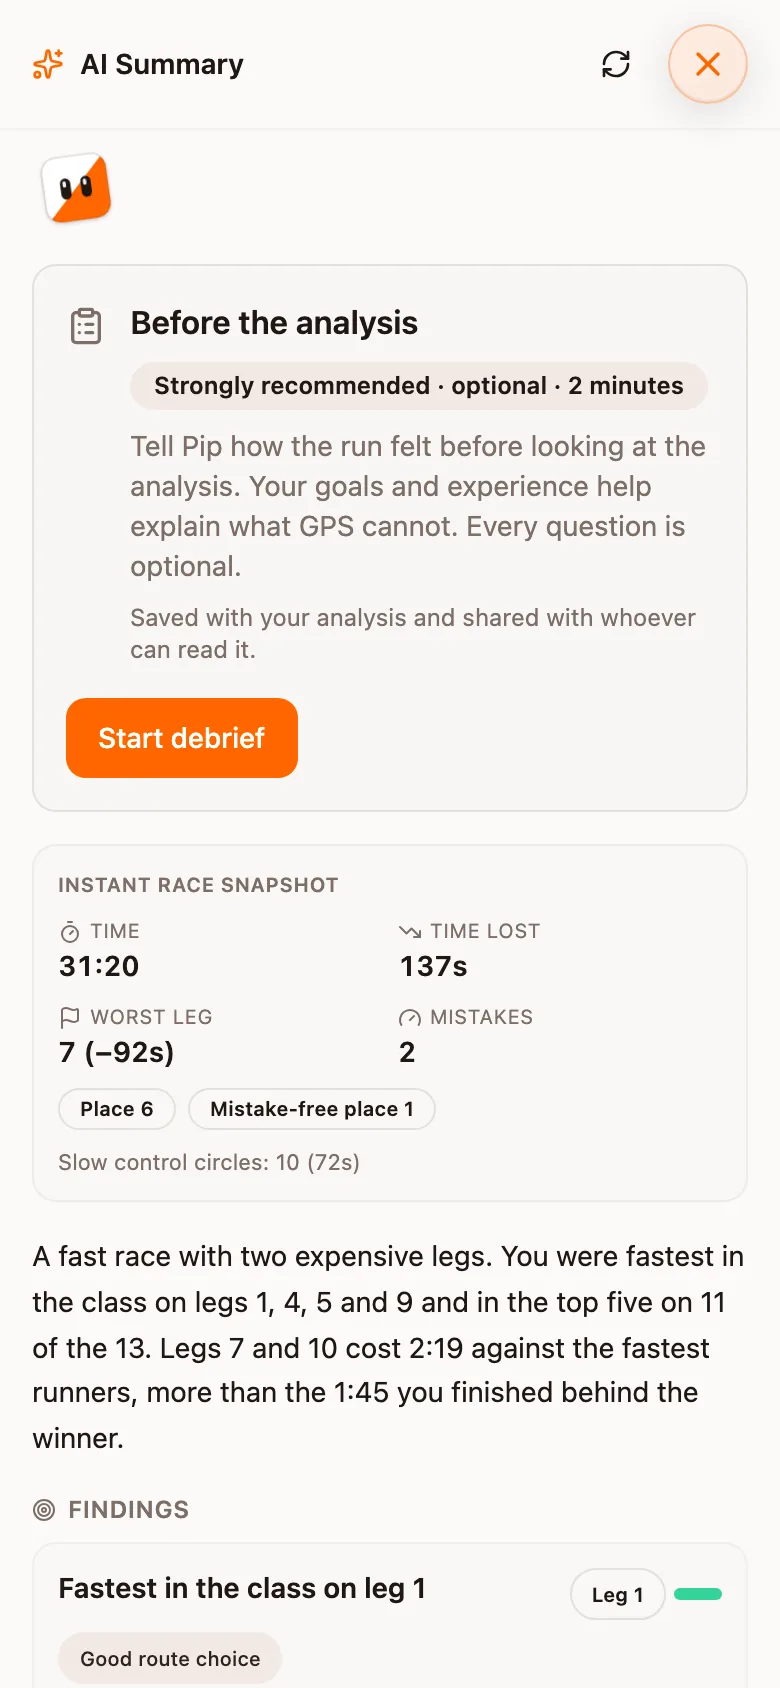
The run opens on the whole course. Full, Per-leg and Replay change how you see the race, and the buttons at the screen's edges open the AI summary, the field comparison and the charts.
What the analysis gives you
| View | What it answers |
|---|---|
| Full course | What shape was the race, and where did the mistakes cluster? |
| Per-leg | What happened on this leg, and how did the others run it? |
| Replay | Who was where at the same moment? |
| Field comparison | Where did I gain and lose time against the class? |
| Mistakes, performance and terrain | What did the mistakes cost, and how did the ground change my pace? |
| AI summary | What went well, what hurt, and what should I train? |
Without split times
Sprint gets extra machinery
A sprint event is also turned into a passability model, so Analyse can work out the shortest legal path for every leg, show it as a ghost runner, and snap a noisy urban track to the streets. See Sprint analysis.
Where to go next
Uploading your GPX
A GPX file, Intervals.icu or a connected watch: whichever your device allows.
Uploading an event
The organiser's job, and the two timing rules that make everybody else's analysis work.
Full course
The whole race on the real map, and what the toolbar and the sheets hold.
Split times
Fifteen views of your race against the class, from the plain table to the loss heatmap.
The AI coach
What it reads, how a review is built, and how to get a better one.
Settings reference
Every default you can set, and the few that change the experience most.