
Settings reference
Everything you can change, with its real default, and the handful worth changing first.
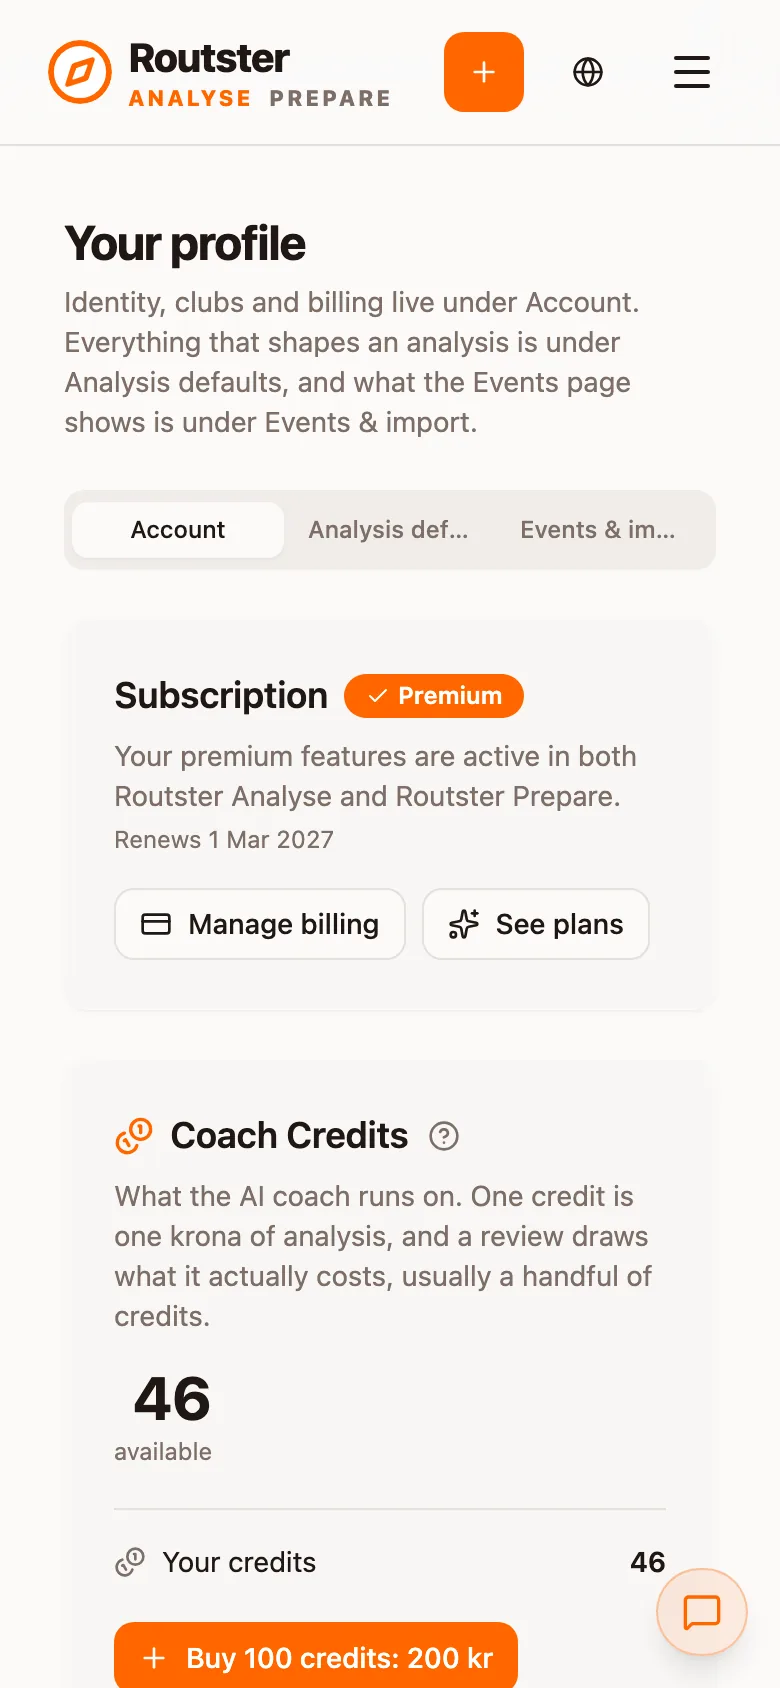
Settings live in your profile, on three tabs: Account, Analysis defaults and Events & import. They are defaults, not locks: almost all of them can be overridden inside a single analysis from the map settings, and doing so does not change the default.
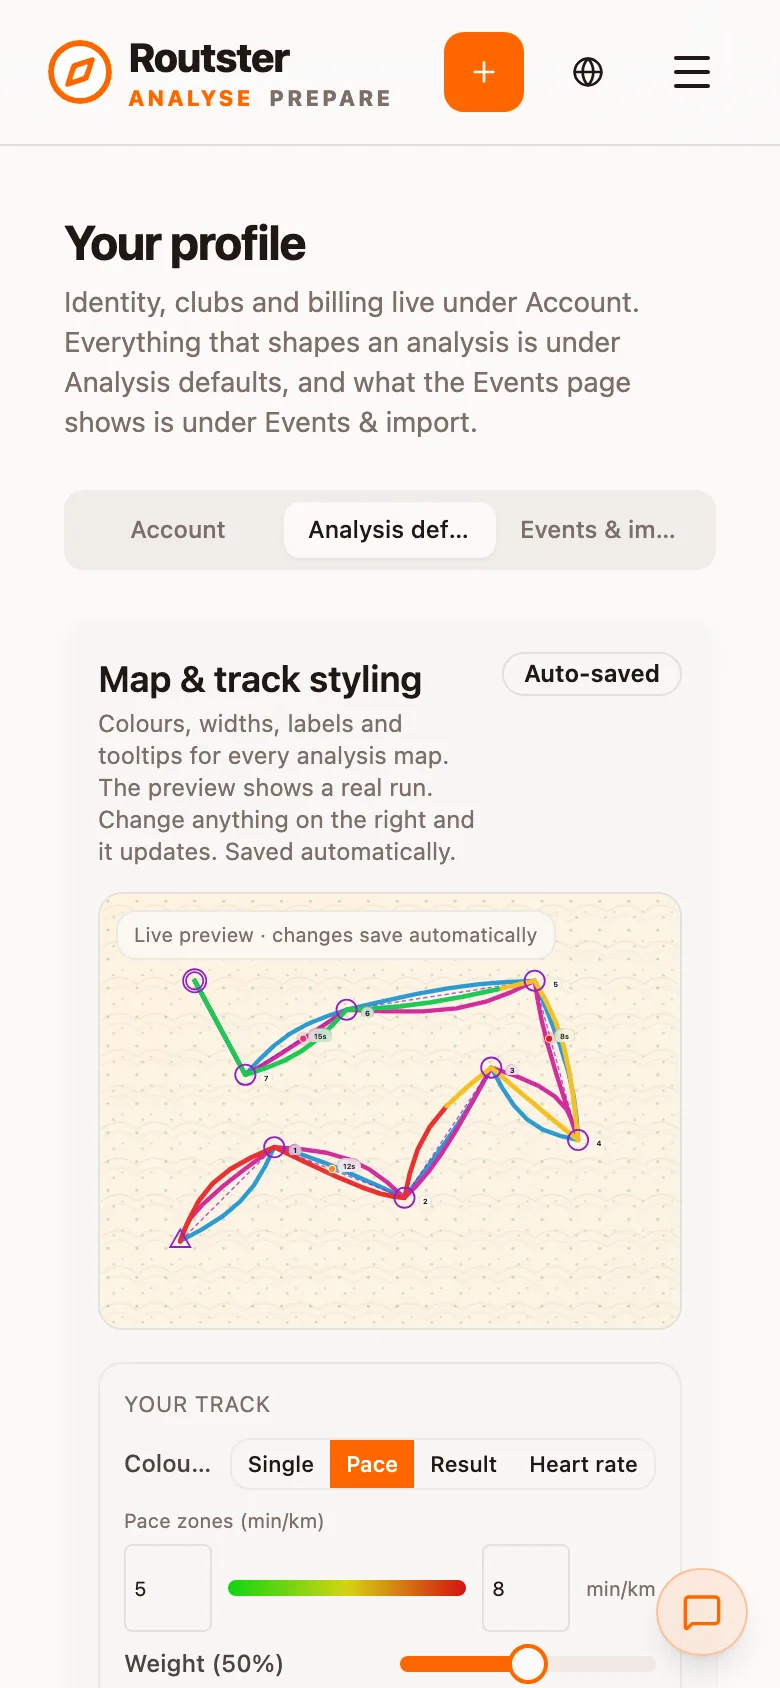
The styling section has a live preview beside the controls, so you can see what a change does to a map without opening a run.
Where settings are stored
The profile, tab by tab
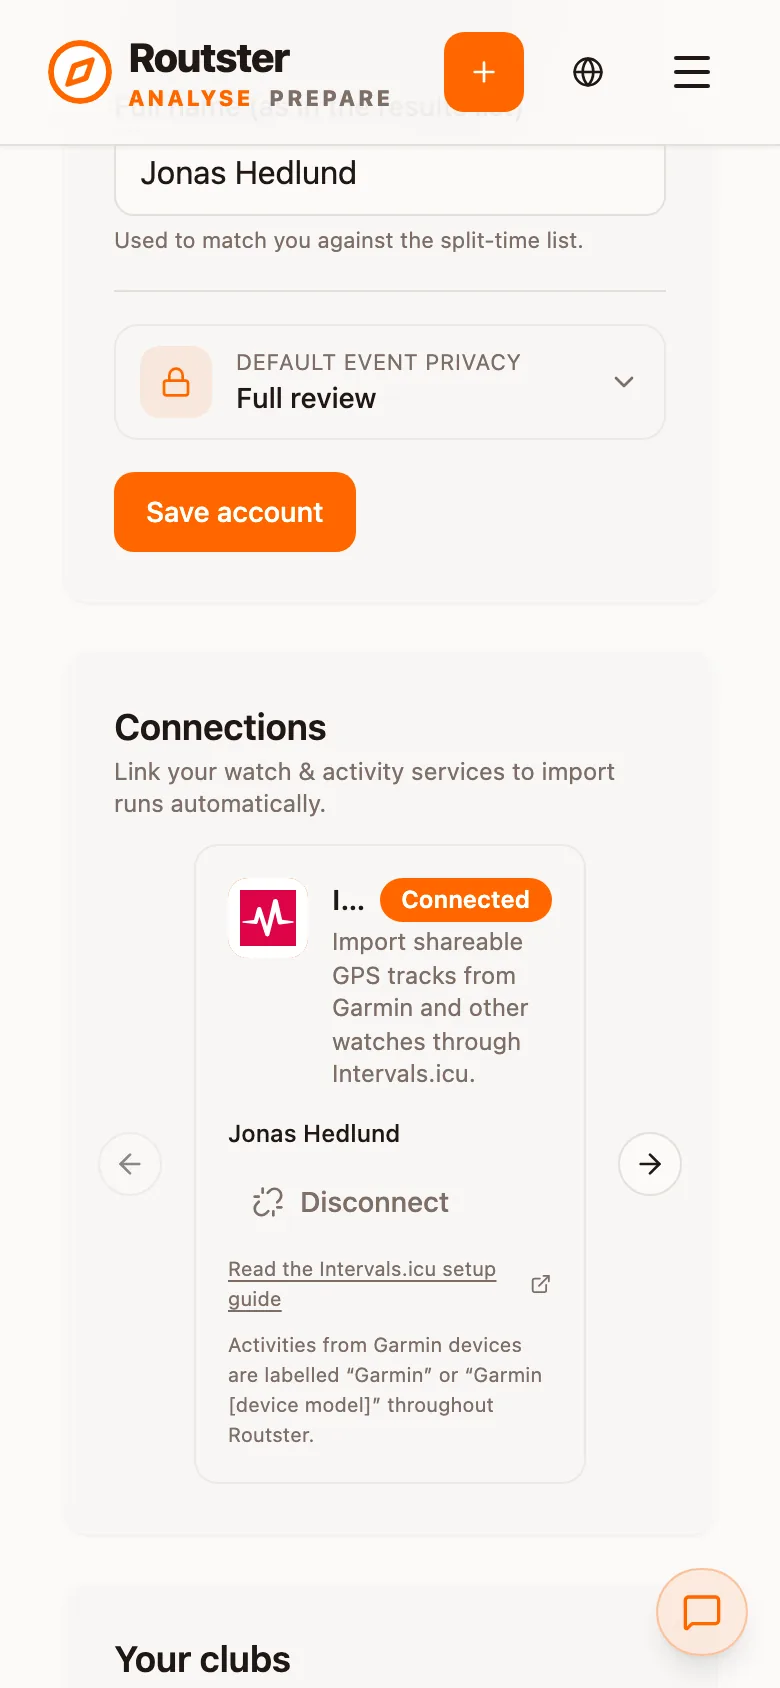
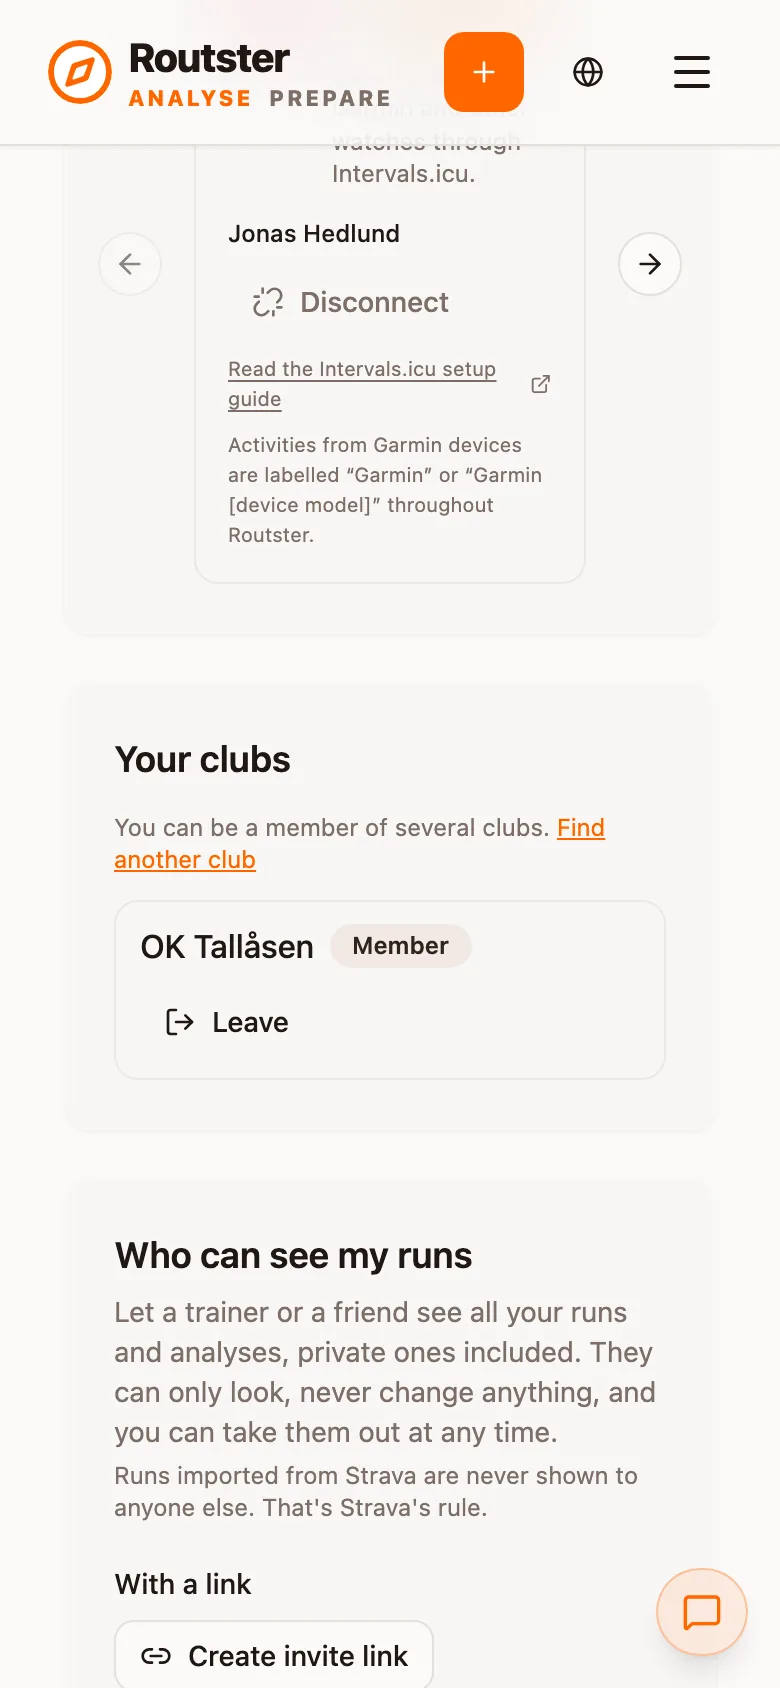
Account holds what belongs to you rather than to an analysis: Subscription, with Manage billing and See plans; Coach Credits, the balance the AI coach draws on, with a button to buy 100 more; Identity, with a profile picture, your email and your full name as it appears in the results list, which is what matches you to a row in the split times, and the default event privacy; Connections, where you link Intervals.icu, Polar or Suunto; Your clubs; Who can see my runs, where you hand a trainer or a friend read-only access with an invite link or by picking a clubmate; and the Danger zone, with Sign out and Delete account.
Analysis defaults is everything that shapes an analysis. Map & track styling comes first, with a live preview that redraws as you change a control, and it saves by itself. Then How a new analysis opens (the default view mode, who is shown automatically, and the rotation and zoom of per-leg view), Replay mode defaults (camera and playback speed), How deeply Pip reads a race (the AI coach tier), Analysis sections and Field comparison views.
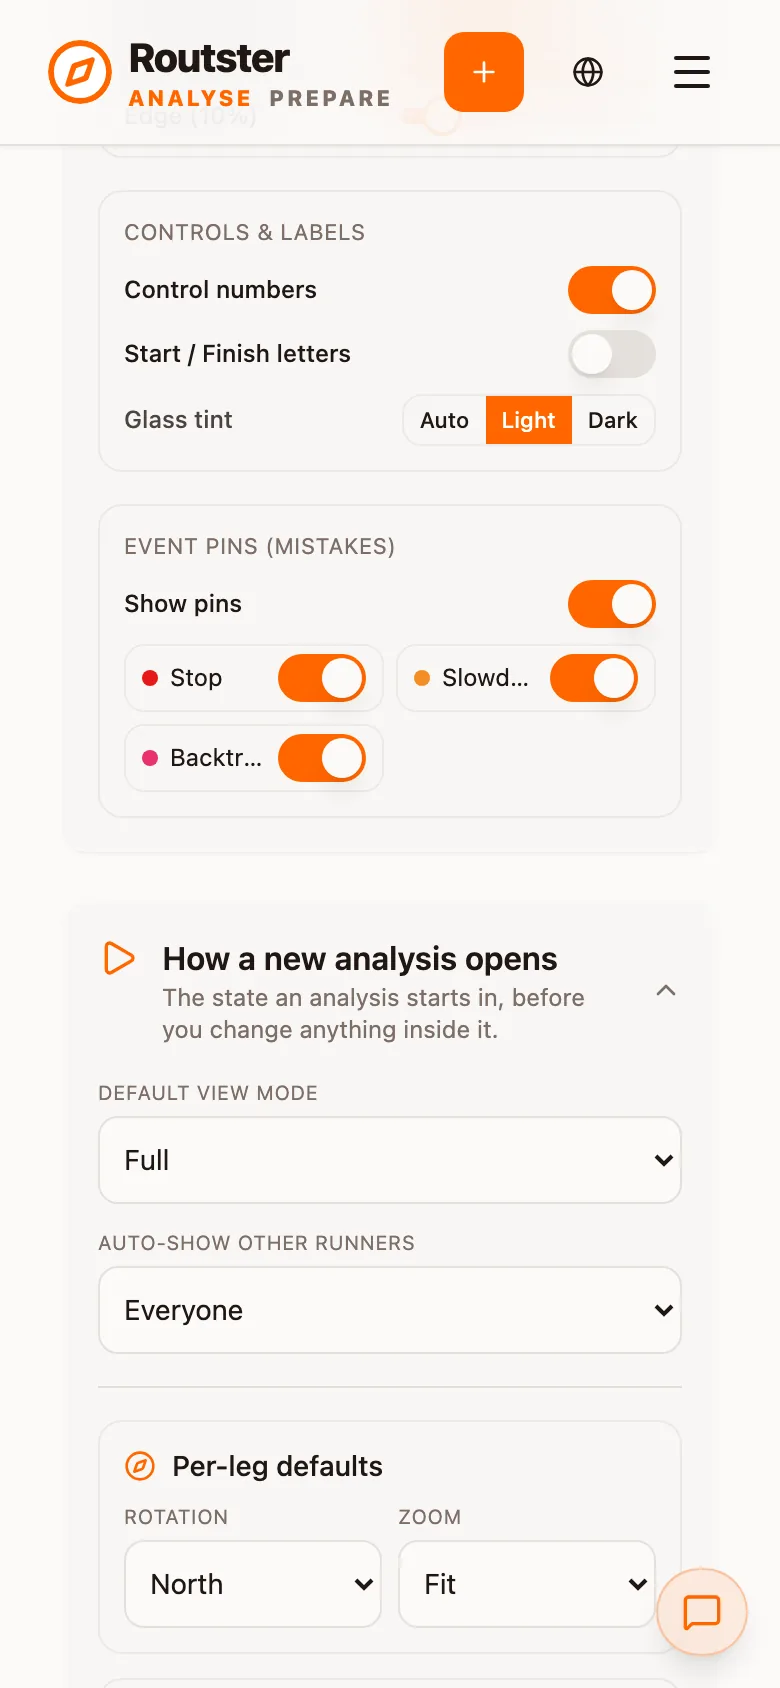
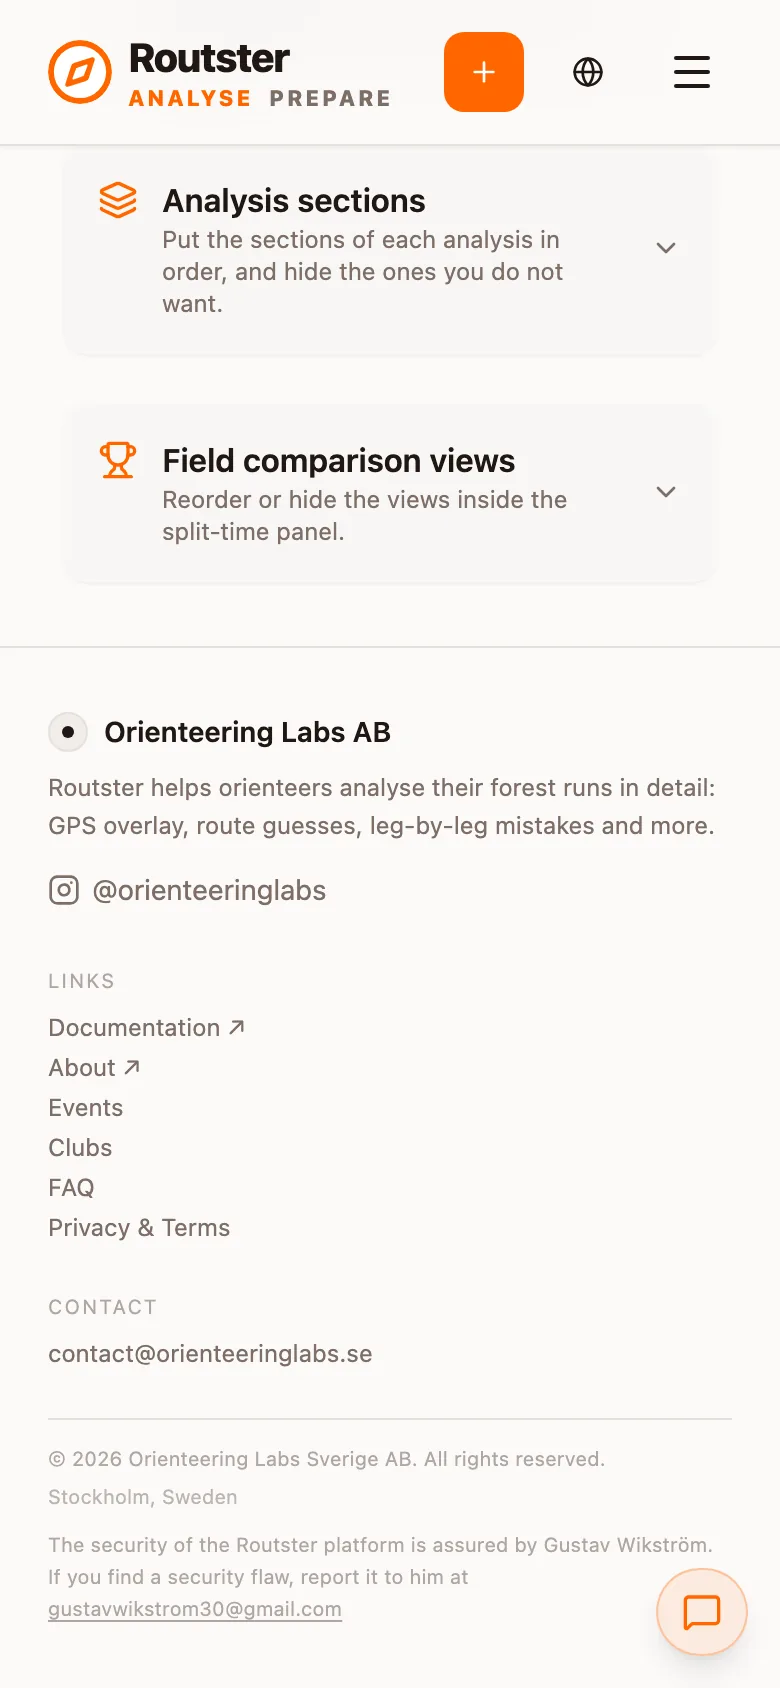
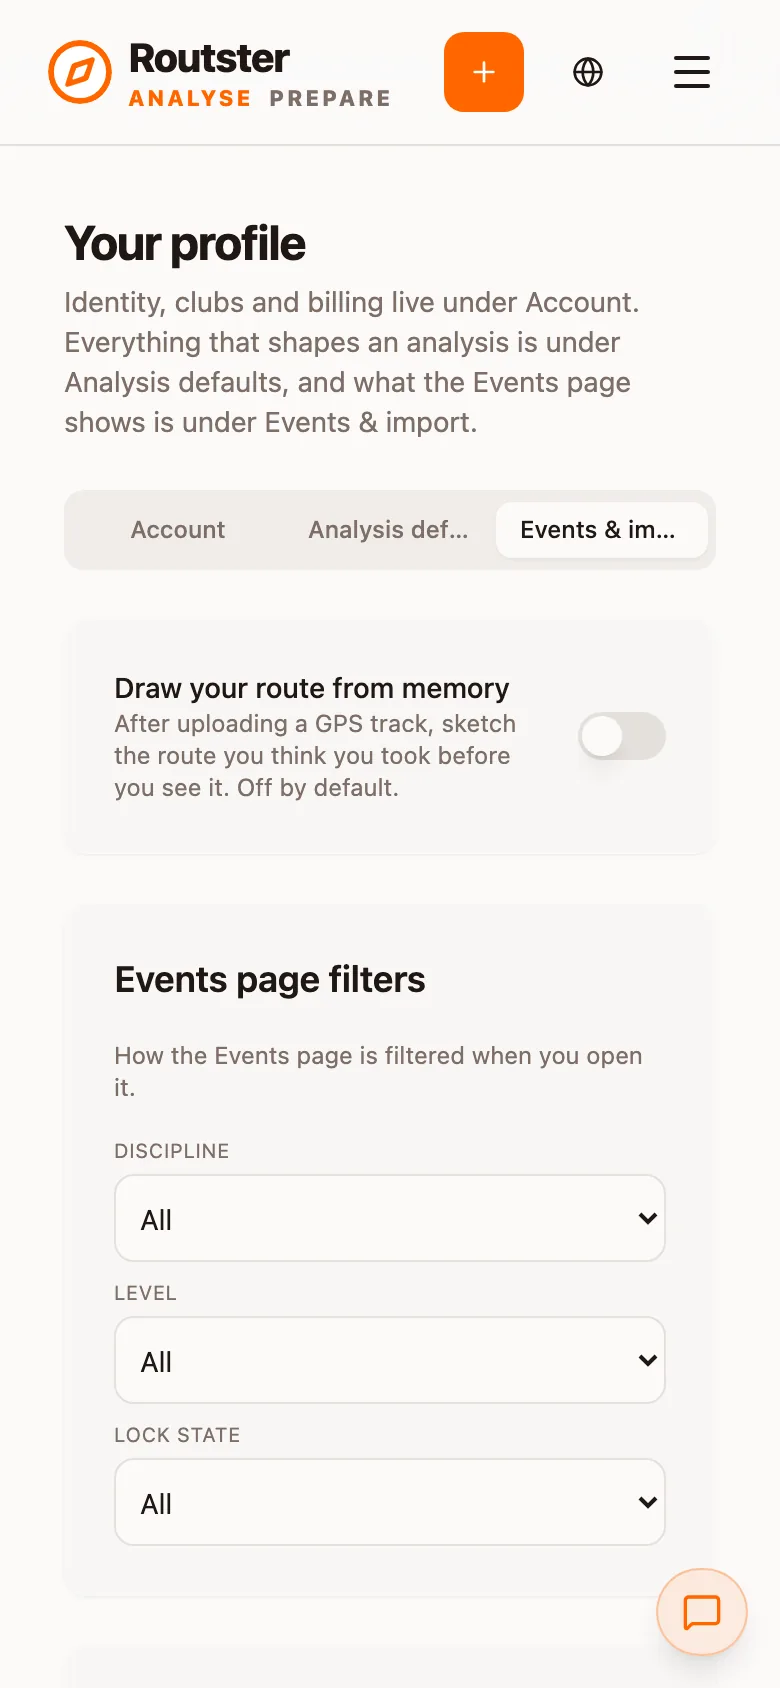
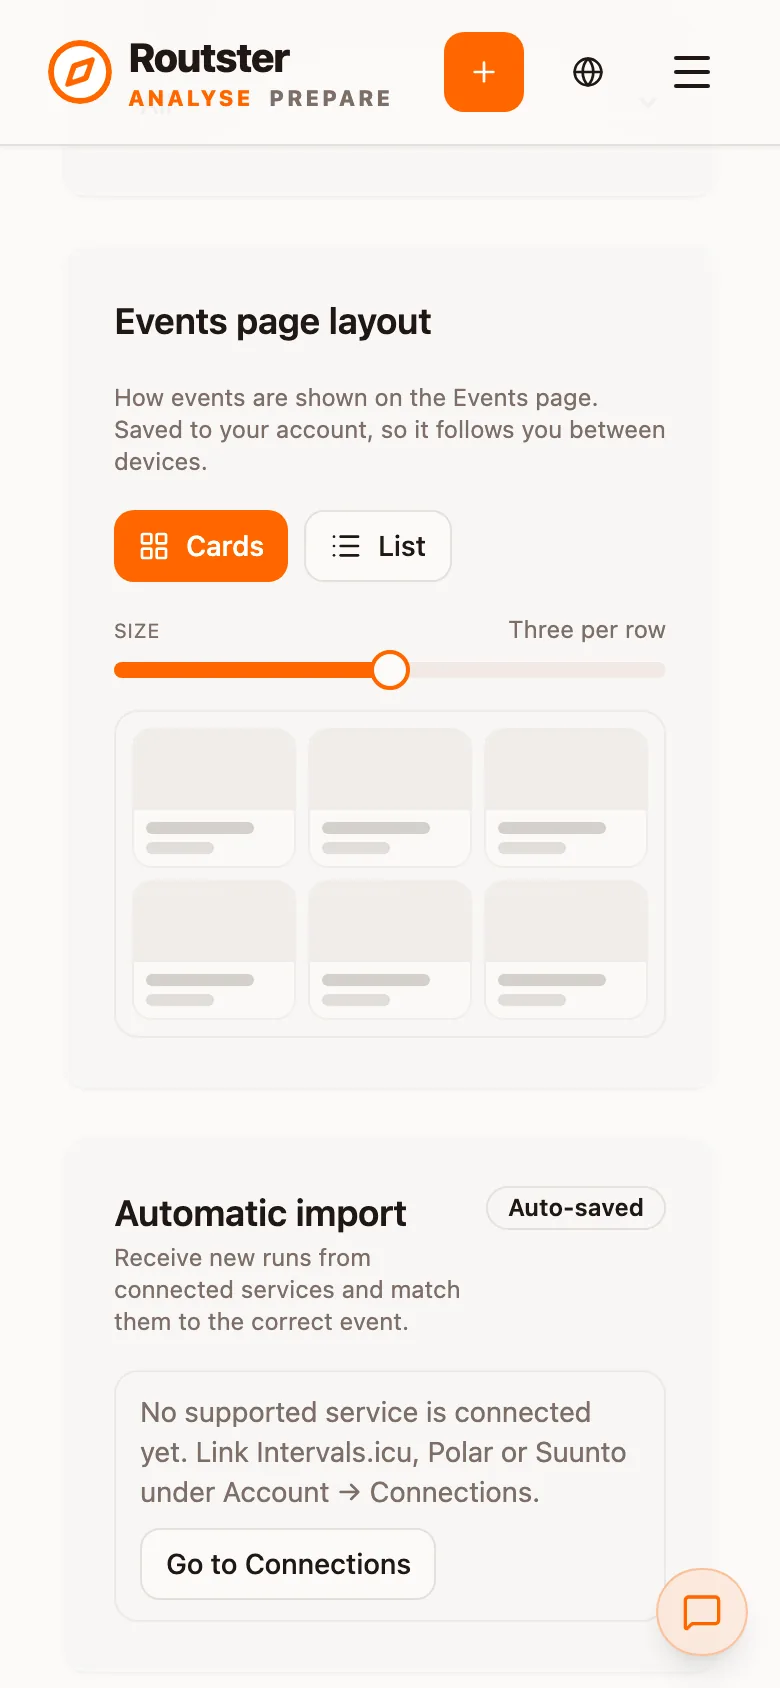
Events & import has the Draw your route from memory switch (off by default), the Events page layout (Cards or List, and the size), the Events page filters that are applied when you open the Events page, and Automatic import. Automatic import needs a connected service: until you have linked Intervals.icu, Polar or Suunto under Account, it says so and offers Go to Connections.
The six with the largest effect
| Setting | Default | Why change it |
|---|---|---|
| Default view mode | Replay | If you mostly read maps rather than watch replays, Full course opens straight into the whole race. |
| Heart-rate zones | 130 / 160 / 180 bpm | Roughly easy, threshold and maximal for an adult orienteer. Set your own, or heart-rate colouring does not describe your effort. |
| Pace zones | 8 and 5 min/km | Forest pace and sprint pace are not the same scale. |
| Route sketch step | Skipped | Lets you draw the route you remember running before the GPS is revealed, to compare against it. |
| Show other runners automatically | Everyone | Narrow it to your club, or turn it off, if a big class makes the map unreadable. |
| AI coach depth | Standard | Quick for trainings, Deep for a race you want examined in detail. See the AI coach page. |
Opening defaults
| Setting | Default | Description |
|---|---|---|
| Default view mode | Replay | Which view an analysis opens in: full course, per-leg or replay. |
| Auto-show other runners | everyone | Whose tracks load with the analysis: nobody, your club only, or everyone who has shared one. |
| Per-leg rotation | run | north keeps the map north-up; run rotates it so that the leg you are on points upwards and you always run towards the top of the screen. |
| Per-leg zoom | fit | How tightly the camera frames a leg: tight, fit or loose. |
| Replay camera | per-leg | follow keeps the camera on you, per-leg jumps leg by leg, free leaves the map where you put it. |
| Replay playback speed | 10× | 1, 2, 5, 10, 20 or 50 times real time. |
| Route sketch step | skipped | Whether to offer the sketch-your-route step after uploading a run. Off by default so it never stands between uploading and seeing the analysis. See Route guess. |
Track colouring
Your own track can be a single colour, coloured by pace, or coloured by heart rate. The two scales below appear under whichever mode is selected, because a scale without its mode beside it is not readable.
| Setting | Default | Description |
|---|---|---|
| Colour mode | pace | Single colour, pace, or heart rate. Heart rate only where the file has HR samples. |
| Your track colour | Routster orange | Used in single-colour mode. |
| Pace zones | 8 / 5 min/km | The slow and fast ends of the pace scale. Everything slower than the first is the slow colour, everything faster than the second is the fast colour. |
| Heart-rate zones | 130 / 160 / 180 bpm | A stored scale rather than the run's own minimum and maximum, so two runs are comparable. Derived per run, the hardest effort in a jog would be as red as the hardest effort in intervals. |
| Track weight | 7 px | Line width of your own track. |
| Track opacity | 0,7 | How much of the map shows through your own track. |
| Track edge width | 0,5 px | A hairline dark edge, enough to lift a track off a busy map without changing its apparent weight. |
| Show warm-up and cool-down | on | Whether the parts of the track before the start and after the finish are drawn. Turn it off on a track that includes a long jog to the start. |
Other runners
| Setting | Default | Description |
|---|---|---|
| Colour mode for others | speed | hue derives a stable colour from the run id, but two runners can land on neighbouring hues; neutral makes them all grey; speed colours their segments by pace like your own track; random gives each visible runner a distinct colour from a categorical palette. |
| Weight | 3 px | Line width for other runners. |
| Opacity | 0,95 | Opacity for other runners. |
| Dashed | on | Draws other runners dashed, so your own solid line is distinguishable at a glance rather than by colour alone. |
| Edge width | 0,5 px | Hairline edge for other runners. |
random suits a crowded class
Labels on the map
A runner's on-map label is two settings: when it appears, and what it says. They are set separately for you and for everyone else, so you can be permanently labelled while the field is not.
| Setting | Default | Description |
|---|---|---|
| Label (self / others) | hover | off never shows it; hover shows it while the pointer is over the track; always pins it. In live playback it rides above the moving marker, and in full course and per-leg it sits beside the track. |
| Label shows (self / others) | name | name is the full name; split is name plus leg or total time, always with the shortened name because the chip has to stay narrow; short is the shortened name alone. |
Course and control drawing
| Setting | Default | Description |
|---|---|---|
| Control size | m | Small, medium or large control circles and labels. |
| Show control numbers | on | The number inside each control circle. |
| Show start and finish letters | off | S and F on the start triangle and finish double circle. |
| Glass label tint | light | The tint behind on-map labels: auto, light or dark. Dark reads better on a pale sprint map; light on a dark forest map. |
Control numbers are drawn in Arial rather than the interface font, as the IOF map specification prescribes.
Replay
| Setting | Default | Description |
|---|---|---|
| Mistake pin display | until next control | How long a mistake pin stays on the map during playback. until-next-control shows it as the playhead passes and clears it at the next control, which keeps the map readable leg by leg; after-passed leaves it up once passed; always shows every pin for the whole replay. Full course and per-leg always show every pin. |
| Your marker style | circle | circle is a filled dot; arrow is heading-aware and shows which way you are running; pulse is a dot in a soft halo, easiest to pick out on a busy map; initials is a small disc with your initials; club logo draws your club badge, falling back to initials when the club has no logo. |
| Other runners' marker style | circle | The same options, set separately, so you can be an arrow while the field stays dots. |
Club logo markers on a mass start
Sprint
| Setting | Default | Description |
|---|---|---|
| Show optimal paths | off | Overlay the pre-computed shortest legal paths for each leg. |
| Optimal paths per leg | 3 | How many alternative optimal lines to draw per leg: 1, 2 or 3. |
| Snap GPS | off | Replace the raw track with a refined one snapped to passable ground. Worth turning on for city sprints where GPS drift puts you through walls. |
| Ghost runner | off | A ghost following the optimal path in live playback, at your own leg times, so you can watch where the line diverges. |
Analysis sections
The panels below the map (mistakes, legs, terrain, charts and deviation) can be reordered, hidden, or set to start collapsed. A hidden panel is not rendered or computed.
| Setting | Default | Description |
|---|---|---|
| Section order | mistakes, legs, terrain, charts, deviation | Drag to reorder. The order applies to every analysis. |
| Section visibility | all visible | Hidden sections are not computed or rendered. |
| Collapsed by default | varies | Whether a section starts folded. Useful for a section you consult rarely. |
| Collapse warm-up / cool-down terrain | on | The race terrain card stays expanded; the warm-up and cool-down one folds. |
| Leg comparison columns | all on | Which of the eleven columns appear: distance, straight-line distance, time, pace, straight-line pace, climb, descent, mean deviation, events, field rank and terrain mix. |
Split-time views
The field comparison panel has fifteen views. Six are shown by default and the rest are off until you turn them on. You can set both order and visibility.
| View | What it answers |
|---|---|
| Table | The full split-time table: what actually happened |
| Insights | Written summaries of the patterns: where you gained, where you lost, against whom |
| Relative | Each leg as a percentage of the leg winner's time, so long and short legs compare |
| Position | How your place moved control by control, showing where the race was won or thrown away |
| Radar | Your strengths and weaknesses as a shape against the field |
| Leg times | A bar per leg of your own time: the shape of the race, without comparison |
| Mistakes | Only the legs where you lost time, with how much and what kind |
| Cumulative | Total time behind the leader as the race goes on: a steady climb is pace, a step is a mistake |
| Time loss | Seconds lost per leg against your own level rather than against the winner |
| Behind % | Time behind per leg as a percentage, so long legs do not dominate |
| Leg rank | Your placing on each individual leg |
| Best possible | The theoretical winner made from every runner's best leg |
| Loss heatmap | The whole field as a grid, one cell per runner per leg |
| Ran together | Who you were with, and where you caught or lost them (packs and following) |
| Leg stats | Per-leg statistics for the class: spread, median, how decisive each leg was |
Events page
| Setting | Default | Description |
|---|---|---|
| Layout | cards | Cards with map thumbnails, or a dense list. |
| Size | 3 | A step from 1 (most events per row) to 5 (one per row). In list mode the same control sets row density, so it keeps meaning “how much space per event”. |
| Default filters | all / all / all | Discipline, competition level and lock state, pre-applied when you open the page. |
Privacy and imports
| Setting | Default | Description |
|---|---|---|
| Default run privacy | full | The privacy tier pre-selected when you upload a run, GPS only or full. See Run privacy. |
| Auto-import scope | club | club considers only events in clubs you belong to; all considers any published event in the date window. |