
Split times
Where your race sits against the field, and the one distinction that decides whether the numbers are honest.
The field comparison panel measures your run against the rest of the class, from the event's split times.
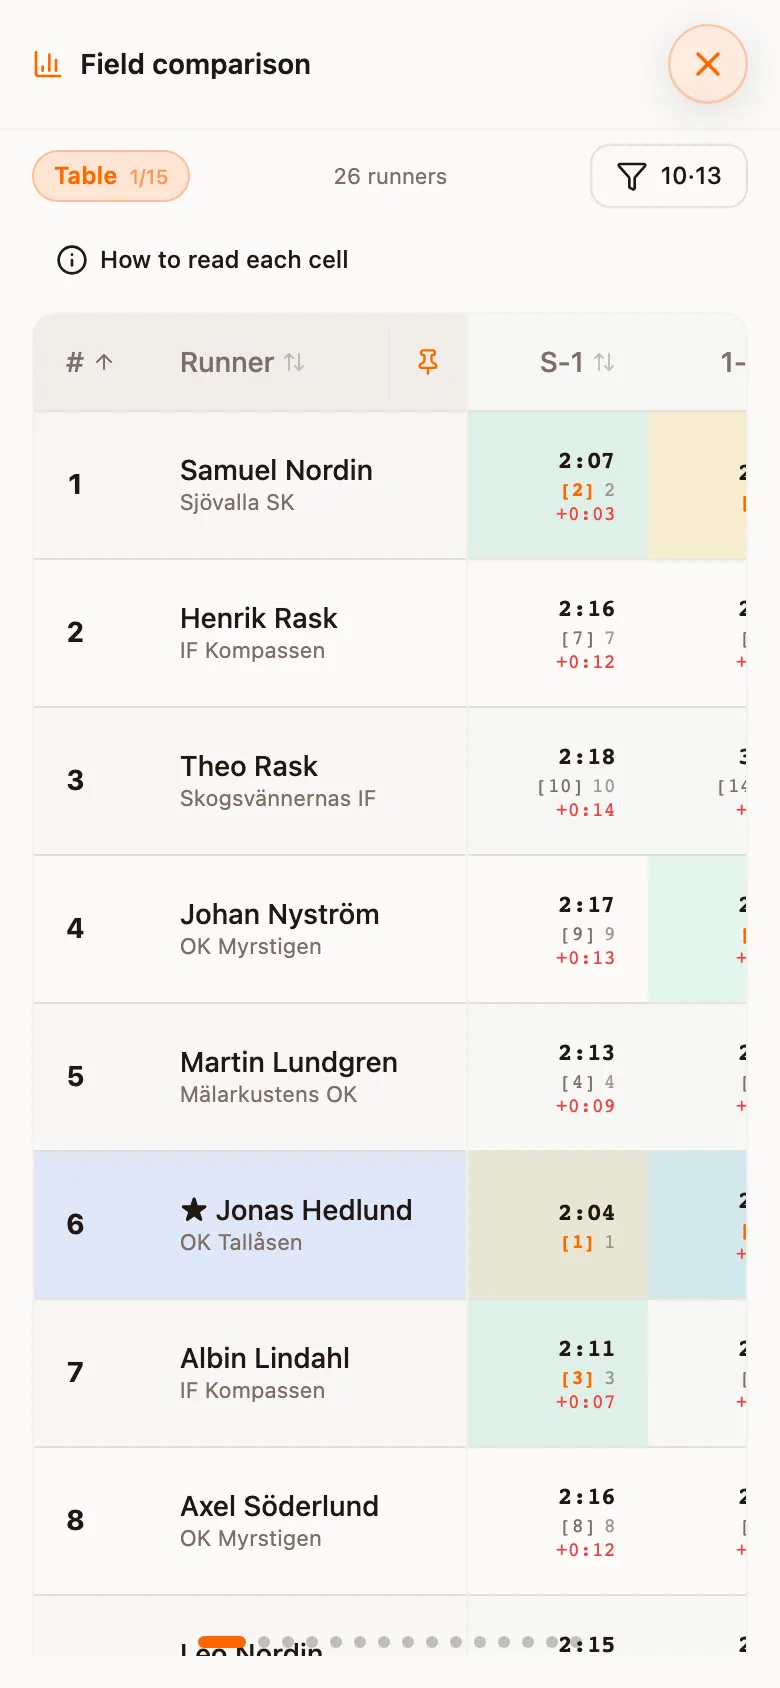
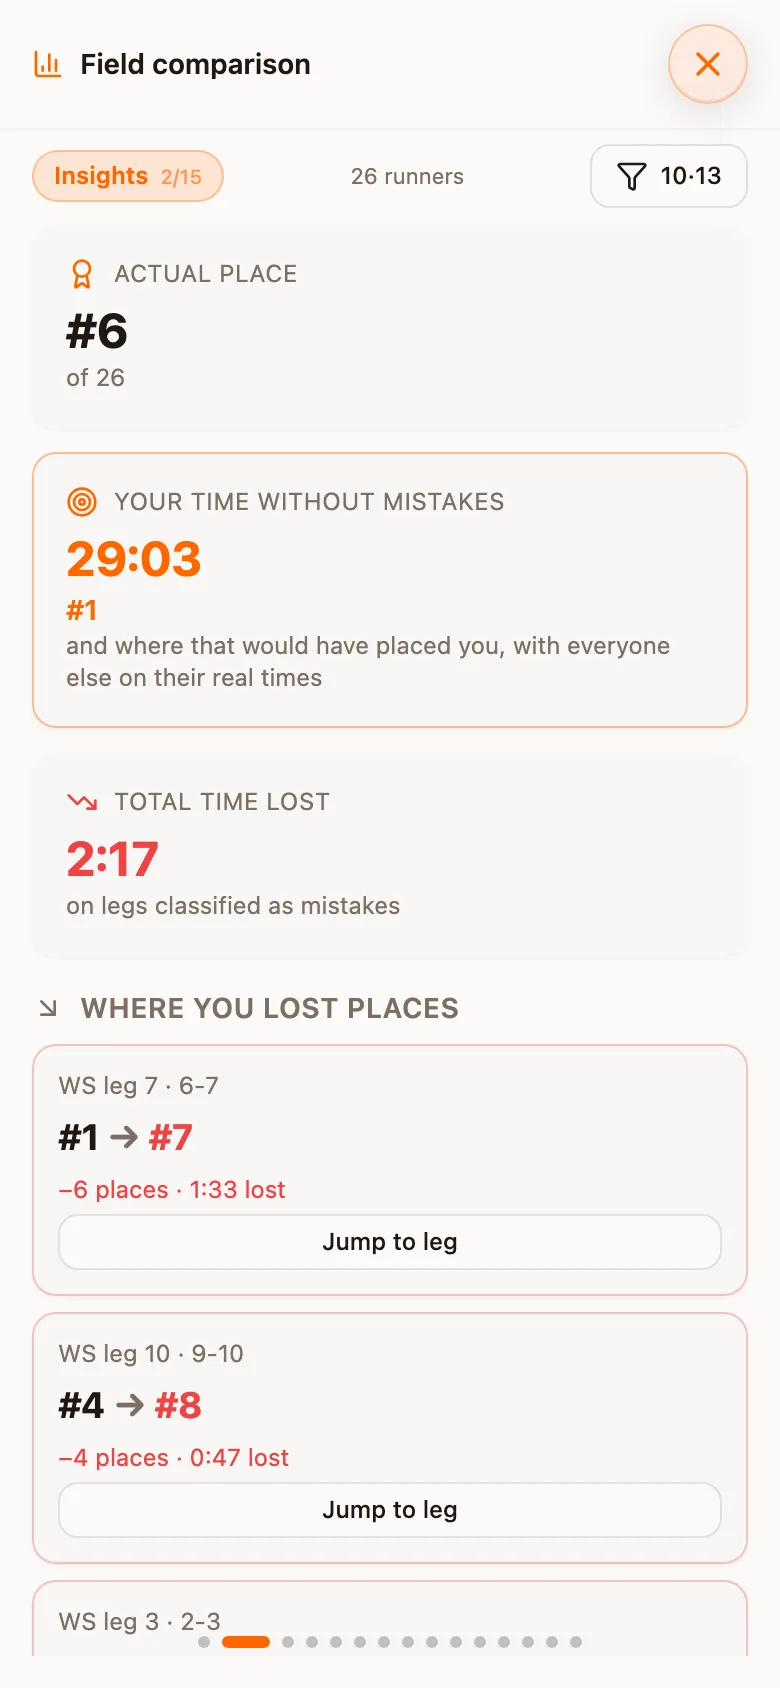
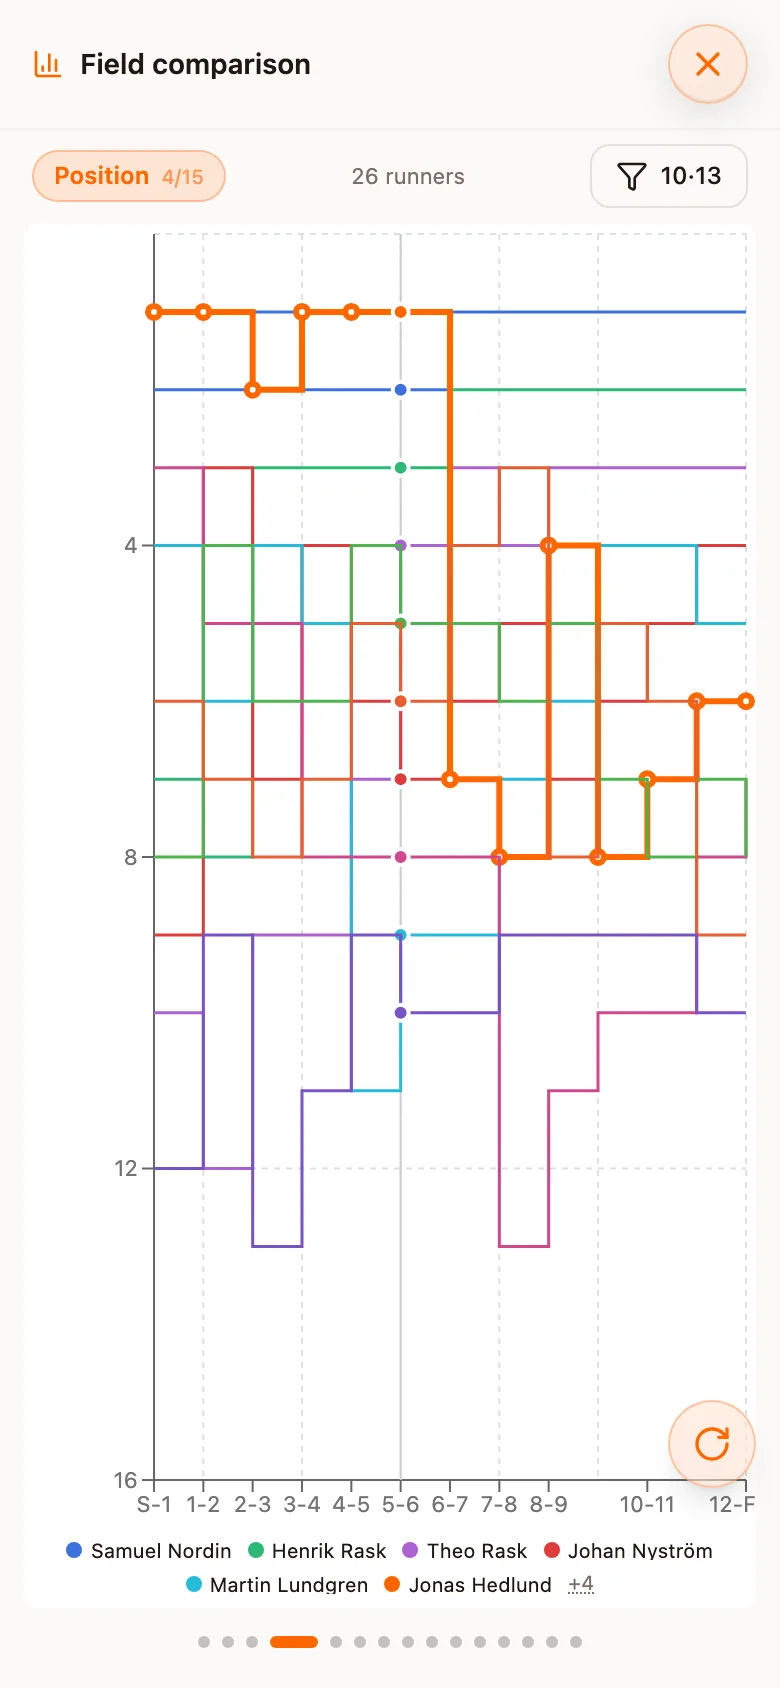
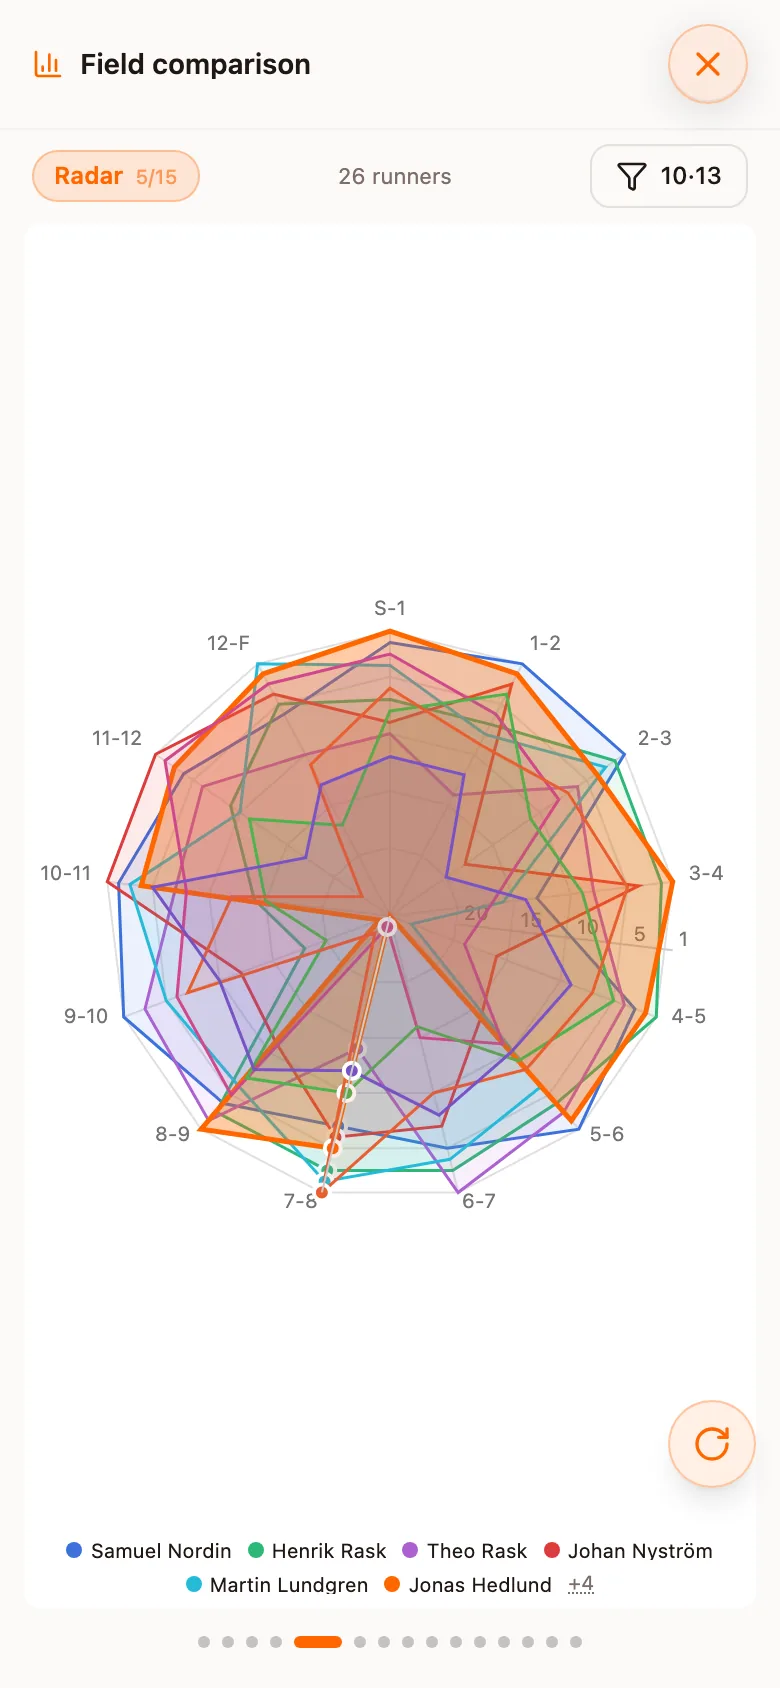
Splits normally arrive from the organiser as an IOF XML result list or a WinSplits link. If an event will have neither, they can instead be estimated from the runners' uploaded GPX tracks. See Uploading an event.
GPX estimates when no result list will exist
Official results are the better source
GPX-derived events still get the full split table and all fifteen comparison views. Times appear as runners upload tracks and are labelled as GPX estimates. A control that cannot be matched confidently remains missing; Analyse marks the row DNF instead of inventing a time.
The normal match uses the first close passage. If you passed a control without seeing it and returned later, open Adjust your GPS control matches above the Table view and choose the passage where you actually took it. This advanced setting appears only on GPX-derived events and changes only your own run.
Two different meanings of "time lost"
Gap to the best is not the same as time lost
Analyse keeps both, clearly named, and uses them for different things:
| Measure | Against what | Used for |
|---|---|---|
| Time lost | Your own level, and only on legs the classifier flags as a mistake | Everything a runner reads: the mistake list, the headline, the AI coach's cost figures, and which legs the coach analyses |
| Behind the best | The fastest leg time in the class | Gap charts, where the comparison is the point |
The same distinction governs "place without mistakes". Subtracting the whole gap-to-best from your total while every rival keeps their real time produces a clean time that beats the winner, so the figure is computed from personal losses on flagged legs only.
The fifteen views
Six are shown by default; the rest are off until you turn them on. Order and visibility are set in Settings.
| View | What it answers | Default |
|---|---|---|
| Table | The full split table: what actually happened | On |
| Insights | Written summaries: where you gained, where you lost, against whom | On |
| Relative time | Each leg as a percentage of the leg winner's time, so long and short legs compare | On |
| Position | How your place moved control by control, showing where the race was won or thrown away | On |
| Radar | Your strengths and weaknesses as a shape against the field | On |
| Leg times | A bar per leg of your own time: the shape of the race, uncompared | On |
| Mistakes vs field | Only the legs where you lost time, with how much and what kind | Off |
| Cumulative | Total time behind the leader as the race goes on: a steady climb is pace, a step is a mistake | Off |
| Time loss | Seconds lost per leg against your own level | Off |
| Behind % | Time behind per leg as a percentage, so long legs do not dominate | Off |
| Leg rank | Your placing on each individual leg | Off |
| Best possible | The theoretical winner assembled from every runner's best leg | Off |
| Loss heatmap | The whole class as a grid, one cell per runner per leg | Off |
| Ran together | Who was physically close at the same clock time, measured from uploaded GPX tracks | Off |
| Leg stats | Per-leg statistics for the class: spread, median, how decisive each leg was | Off |
The other eleven views, once they are turned on.
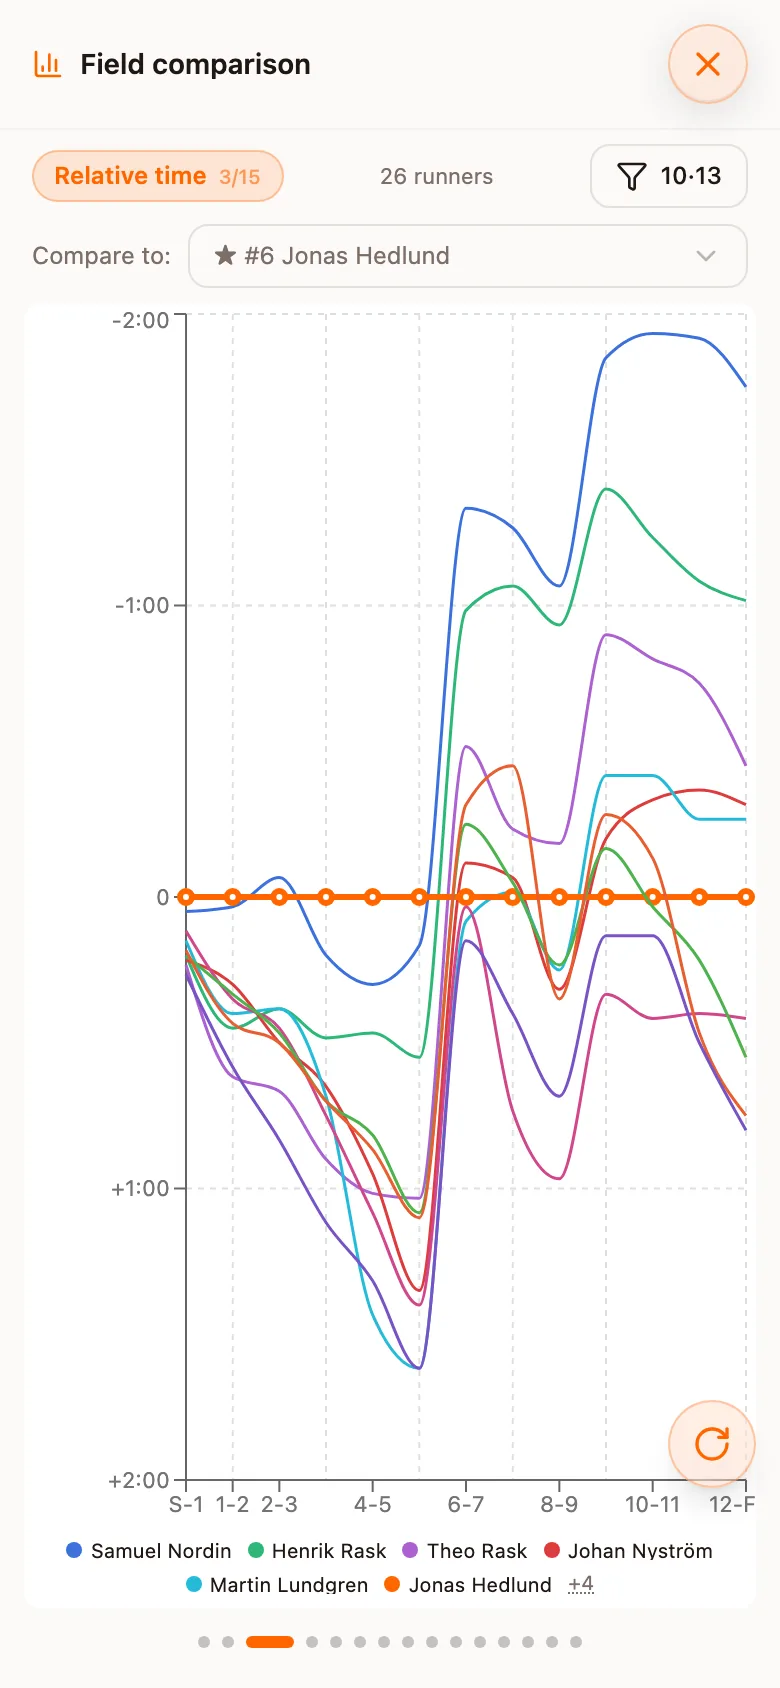
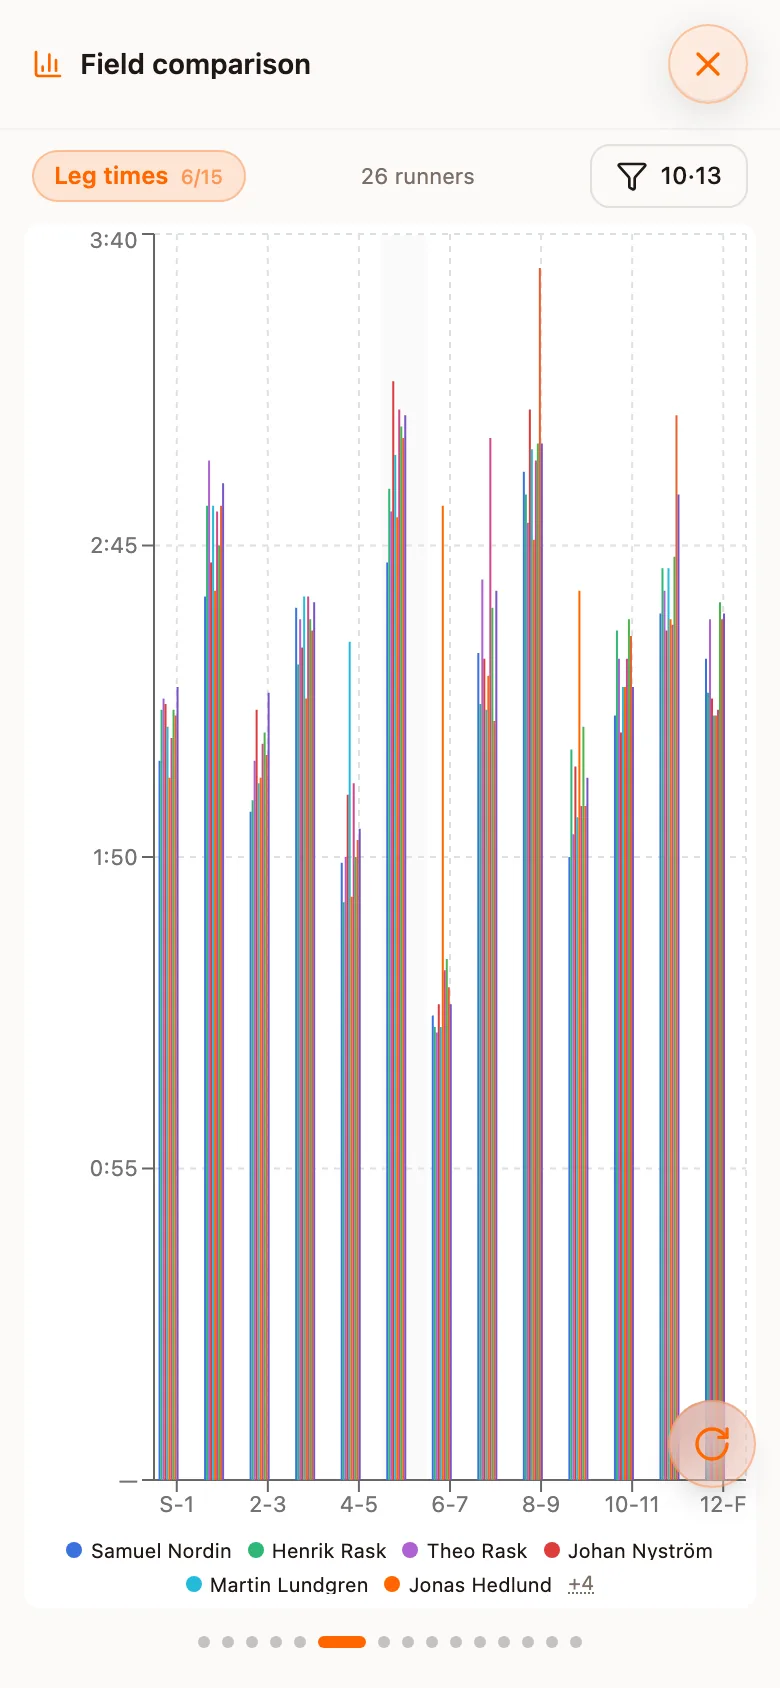
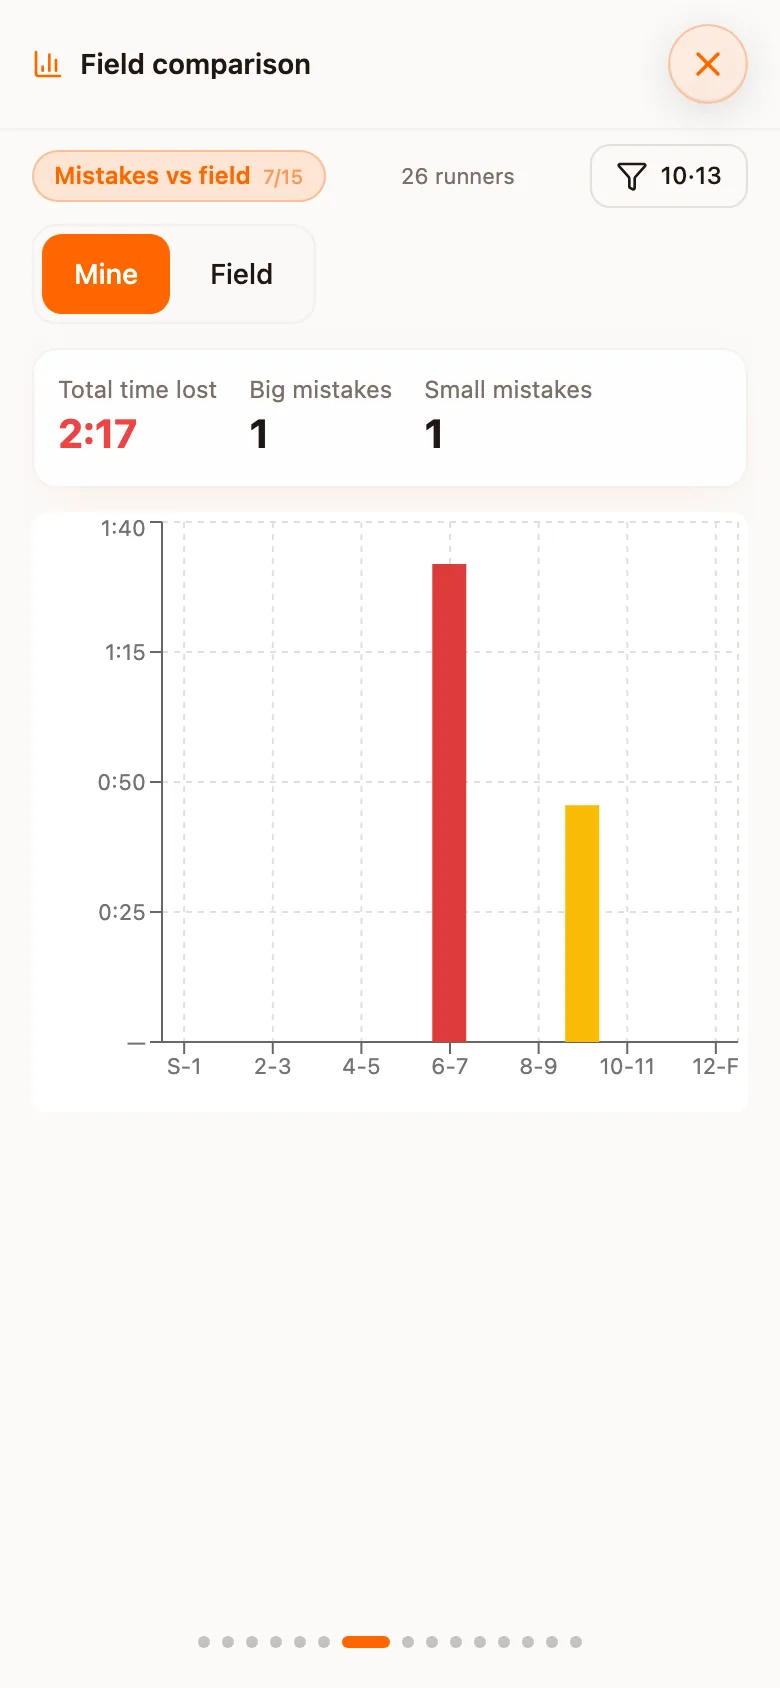
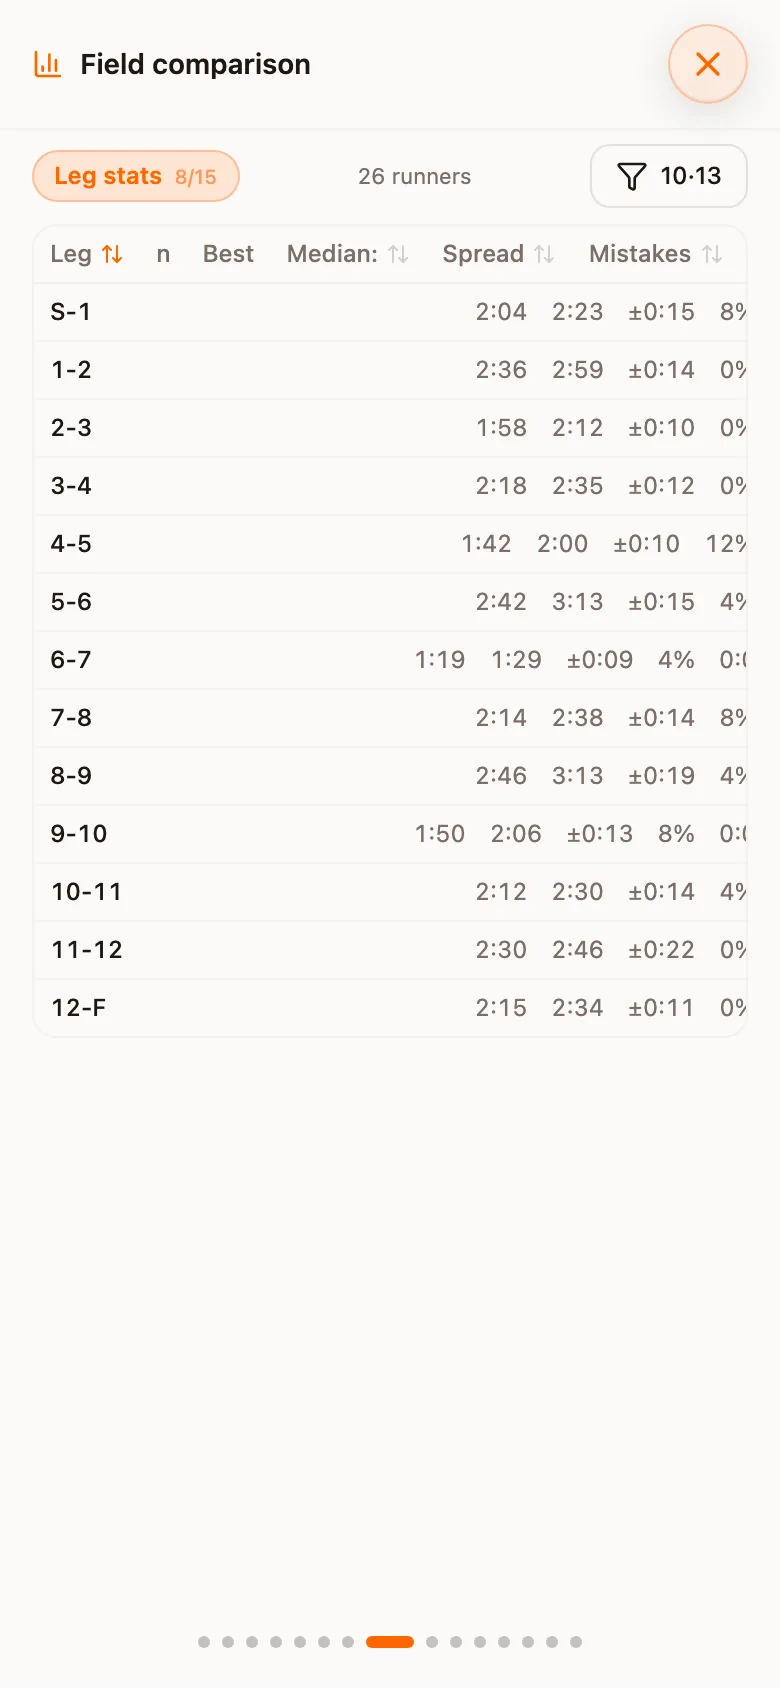
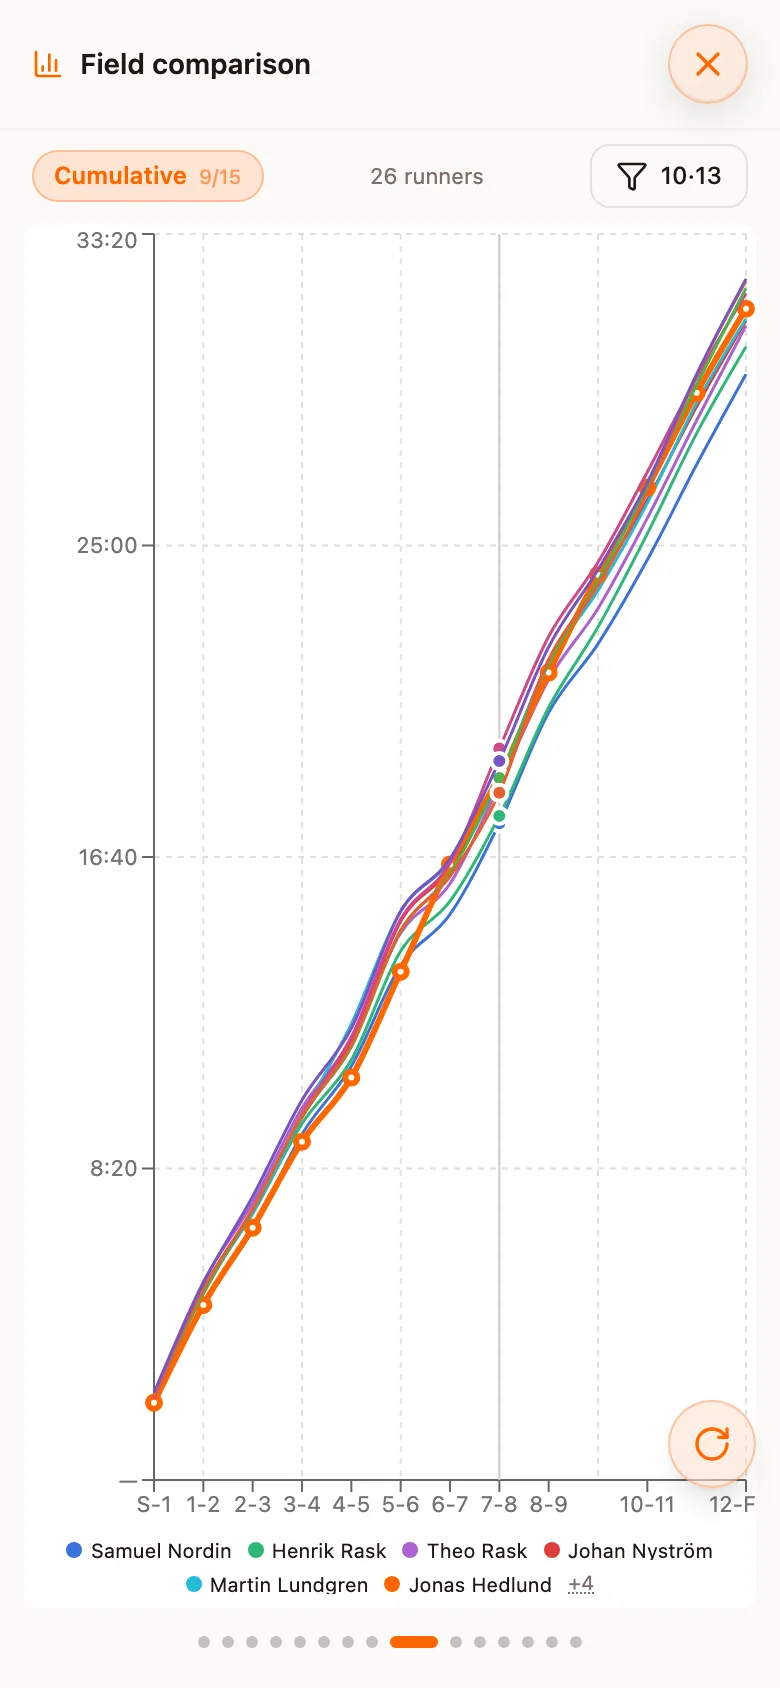
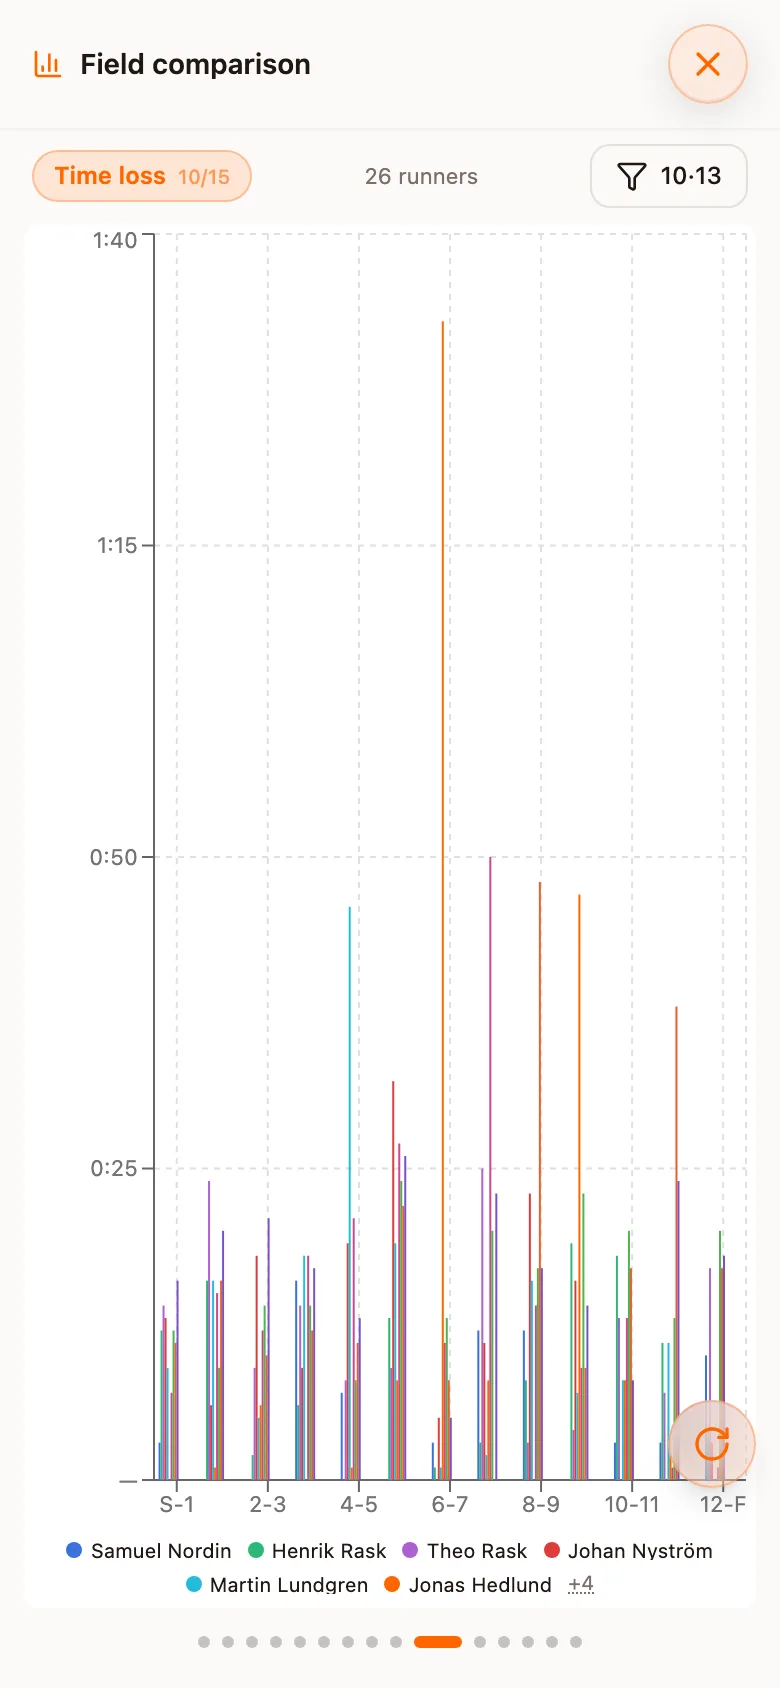
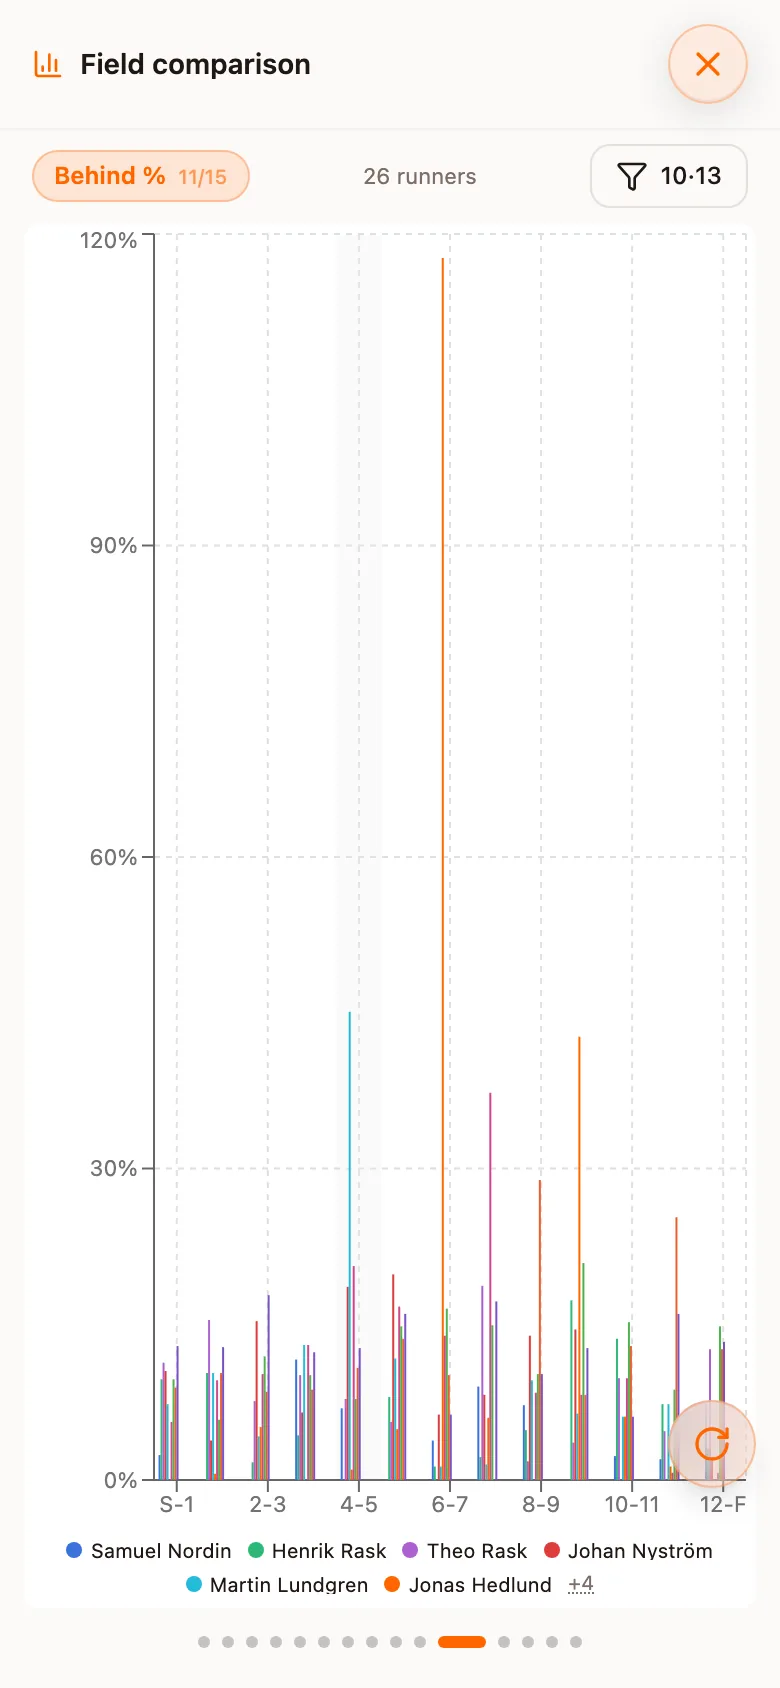
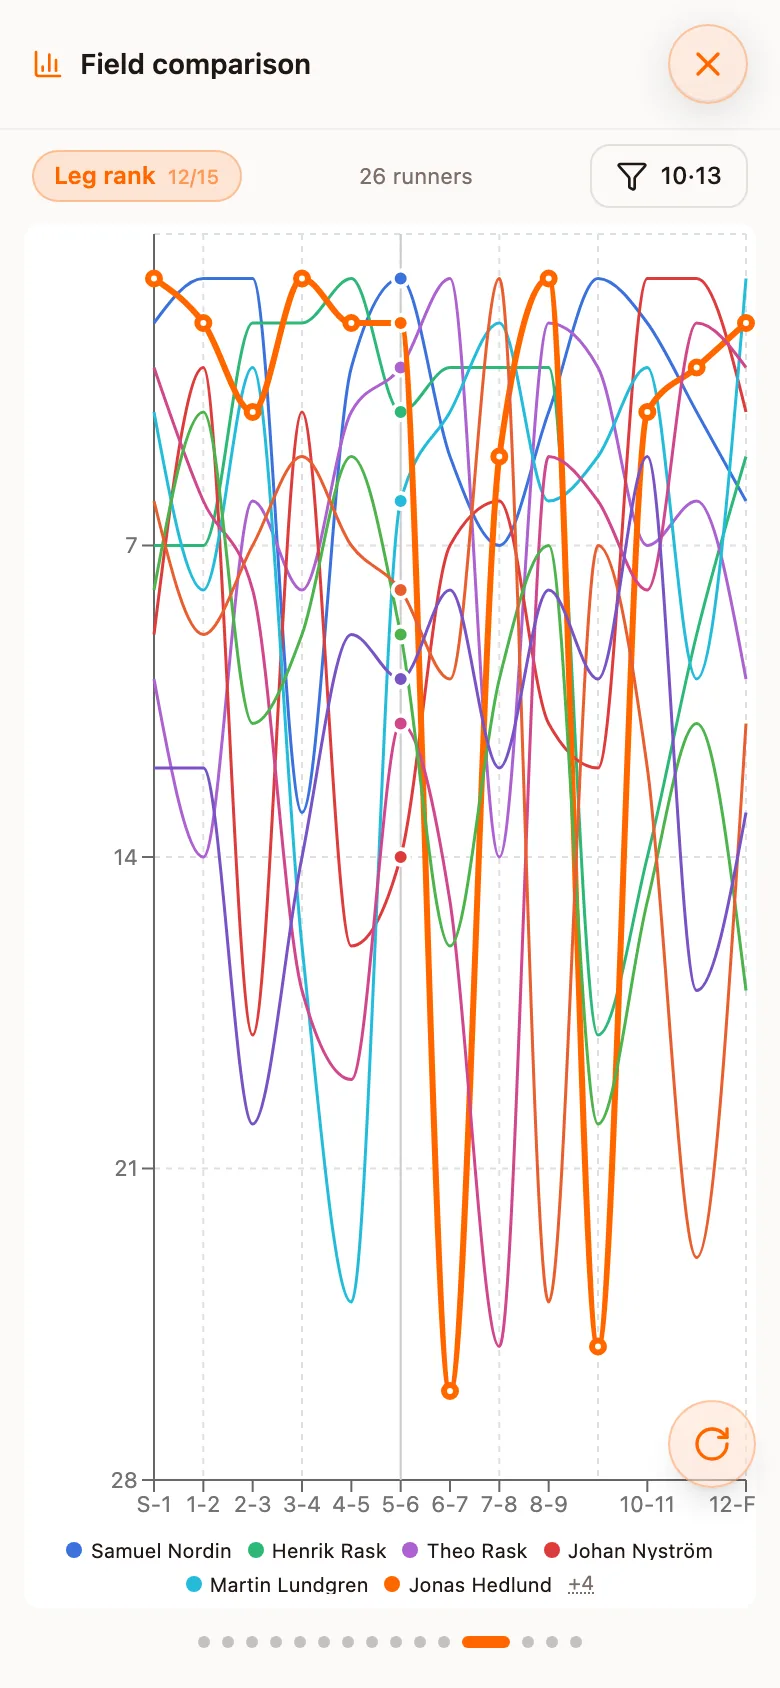
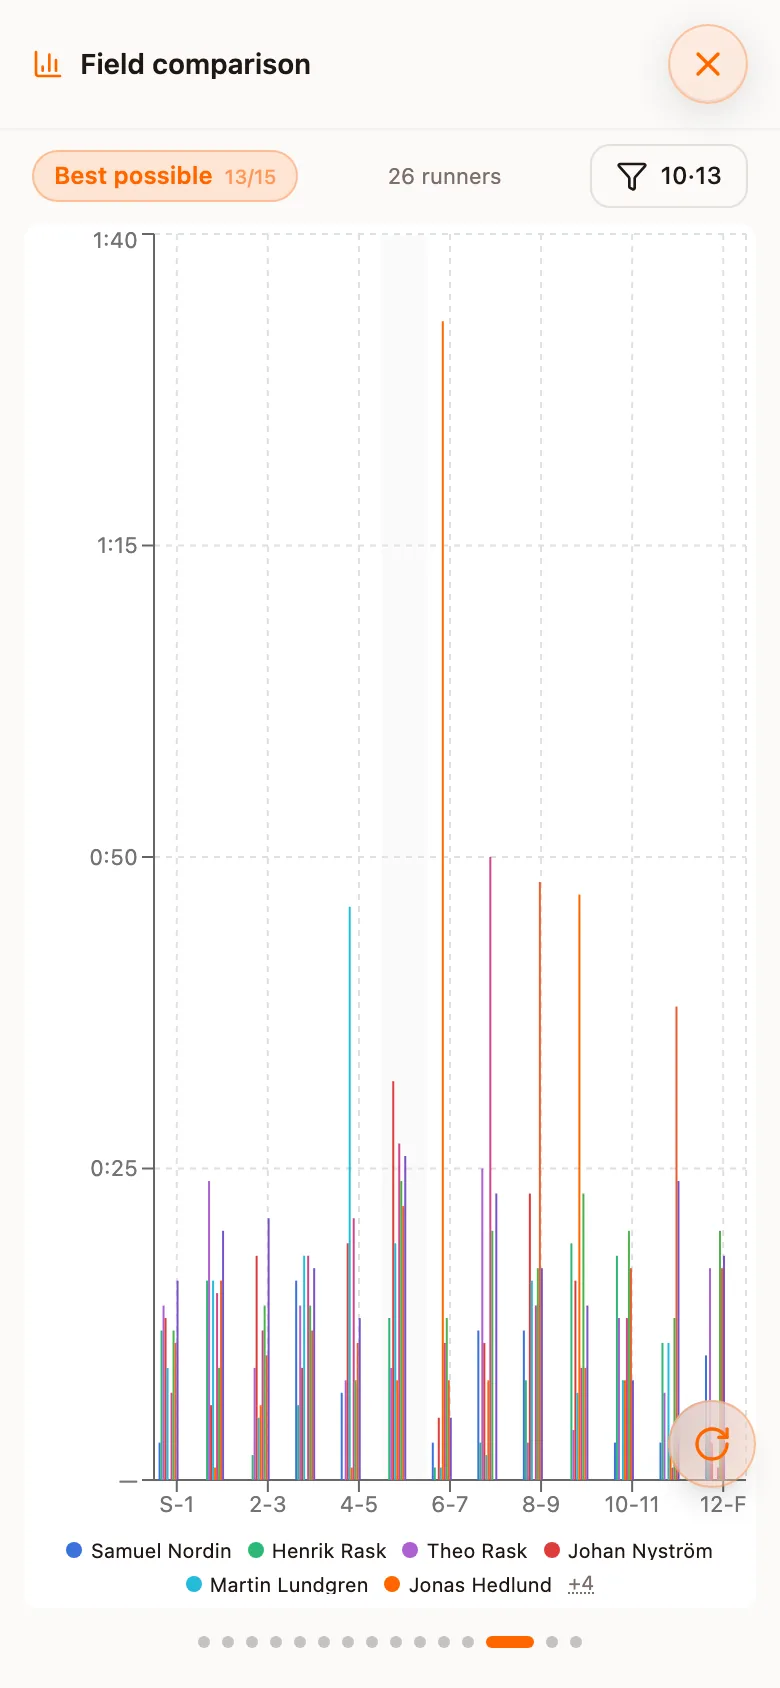
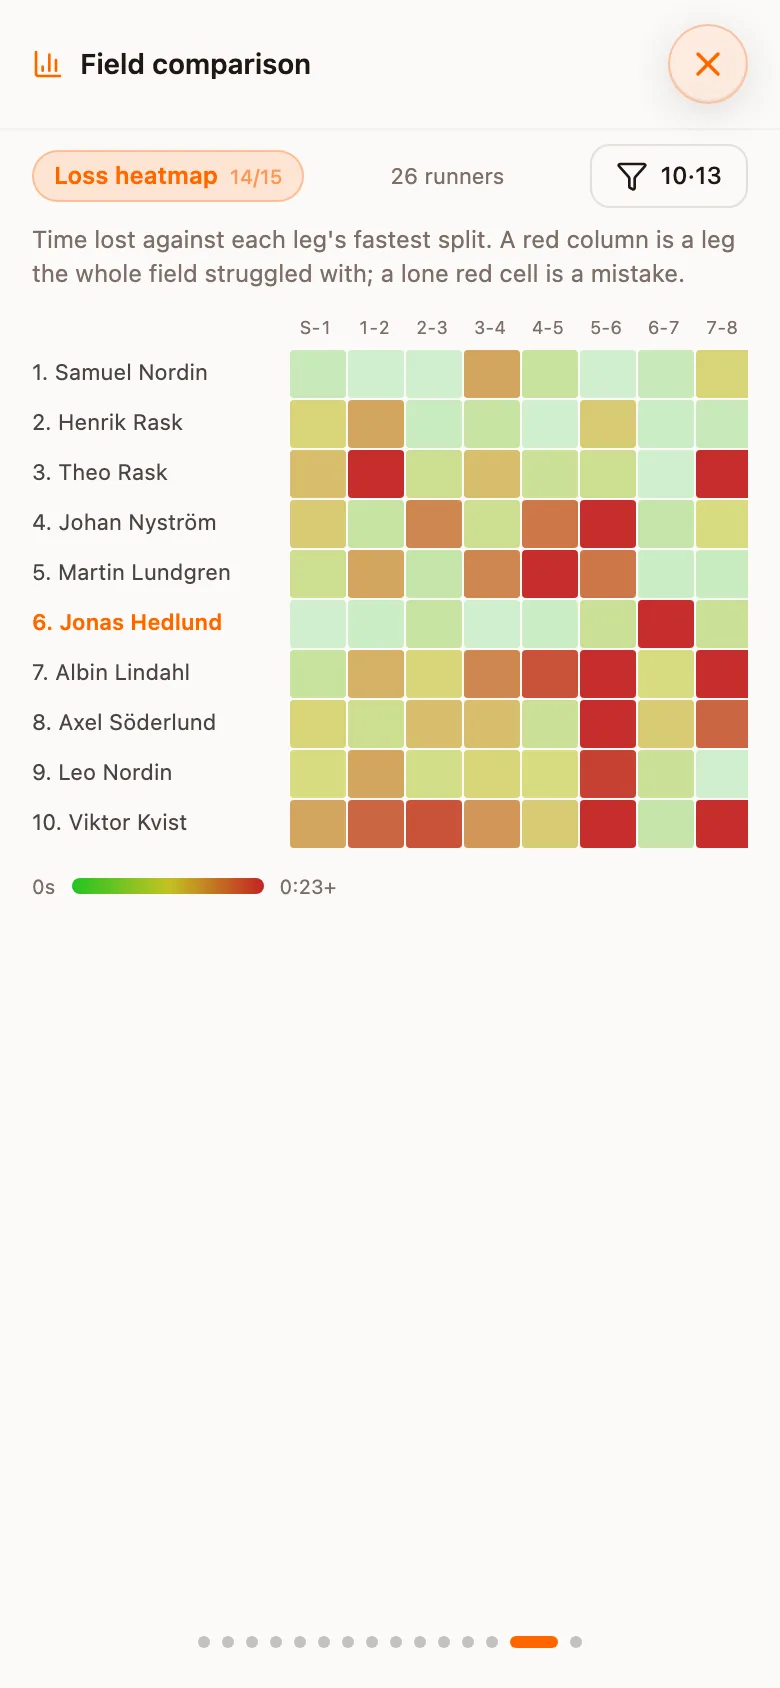
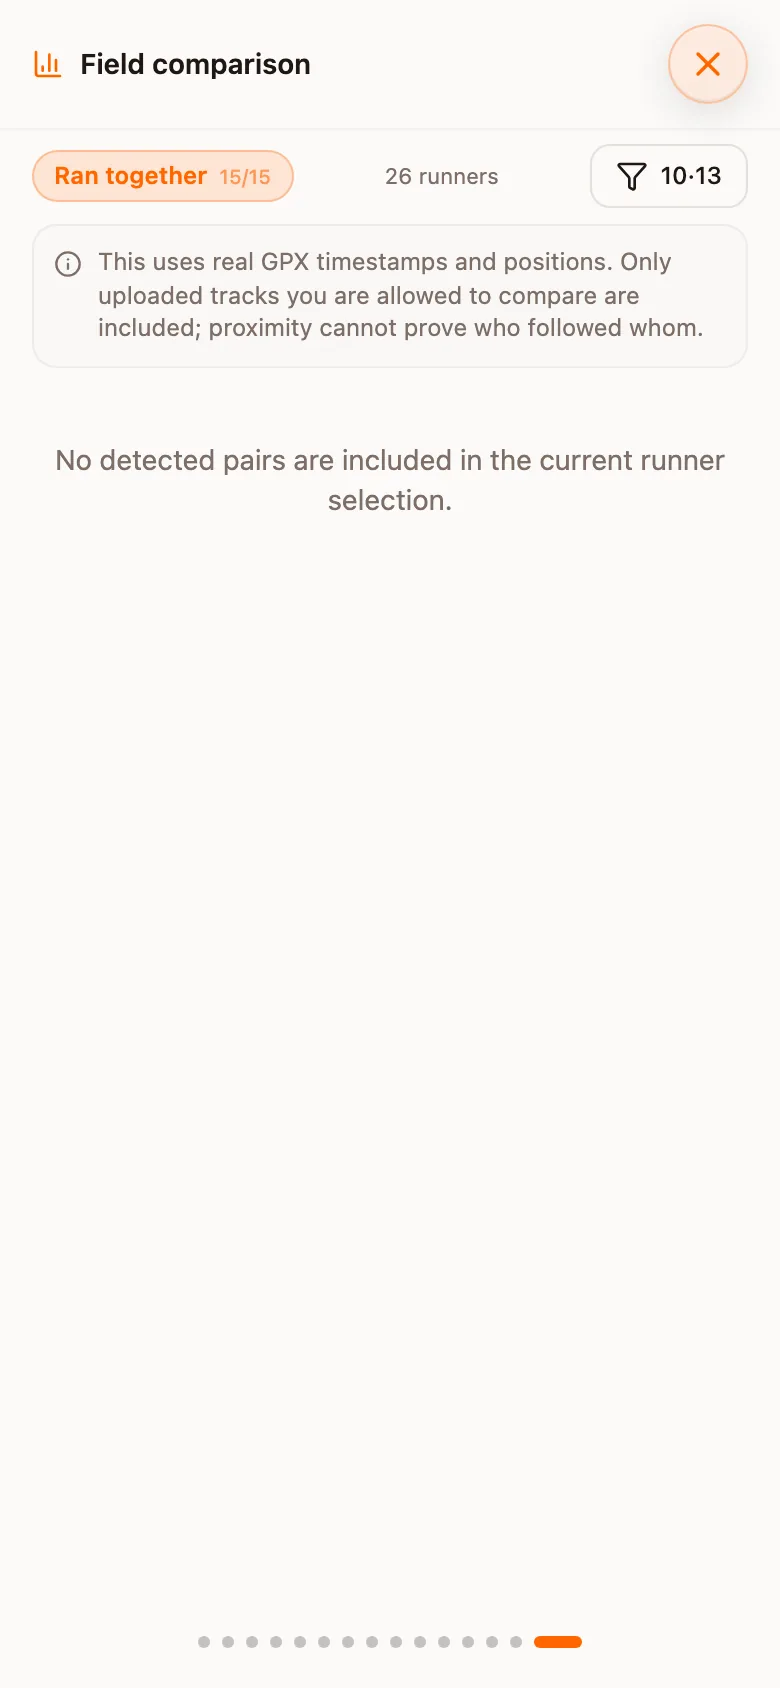
Three of the optional views
Ran together compares real timestamps and positions in uploaded GPX tracks. It reports periods where two runners stayed within 40 metres for at least one minute, with the clock interval, duration, and average separation. This view uses GPX even when the split table itself comes from official results. Runners without a shareable uploaded track are omitted, and proximity cannot prove who followed whom.
Best possible gives the total time available in the class, as context for your own losses.
Leg stats describes the course rather than the runner: a leg with a large class spread was a route-choice leg, one where everyone was within ten seconds was not.
Finding yourself in the sheet
Your row is matched by name: exact normalised matching first, then a match where every part of the name is present, so "Elias Ljungdell" and "Ljungdell Elias" resolve to the same person. You can pick your row by hand if the match is wrong.
Forking
Where a class is forked, one entry in the split sheet often covers several course legs, because the runners did not all visit the same controls. Analyse maps split legs onto course legs explicitly, marks the affected legs, and carries a confidence figure for the alignment.
The leg comparison merges the affected course legs so the map matches the split entry. The AI coach is given the translation from split-leg numbers to course controls, and refuses a route comparison across a forked leg.
Forking is declared by the organiser or read from the result file, not inferred from the spread of leg times: a race with two large mistakes produces the same long-tailed distribution that forking does.
Mispunches and non-finishers
Rows that are not a clean run of the course (mispunched, disqualified, over time, did not finish, did not start, not competing) are excluded from every reference time, so they cannot affect a leg's benchmark.
Sverigelistan points
For Swedish events, Analyse can estimate the ranking points a class produced, following the published formula: the mean points of the three best-ranked starters, the mean of the three best times capped at 1.10× the winning time, and the class constant that follows from them. With fewer than three ranked runners or fewer than three finishers, no estimate is offered rather than a bad one.
It is an estimate, computed from the rankings known at the time and the times in the sheet, and is not the official calculation.