
Per-leg
One leg at a time, framed to the leg and turned so you always run up the screen.
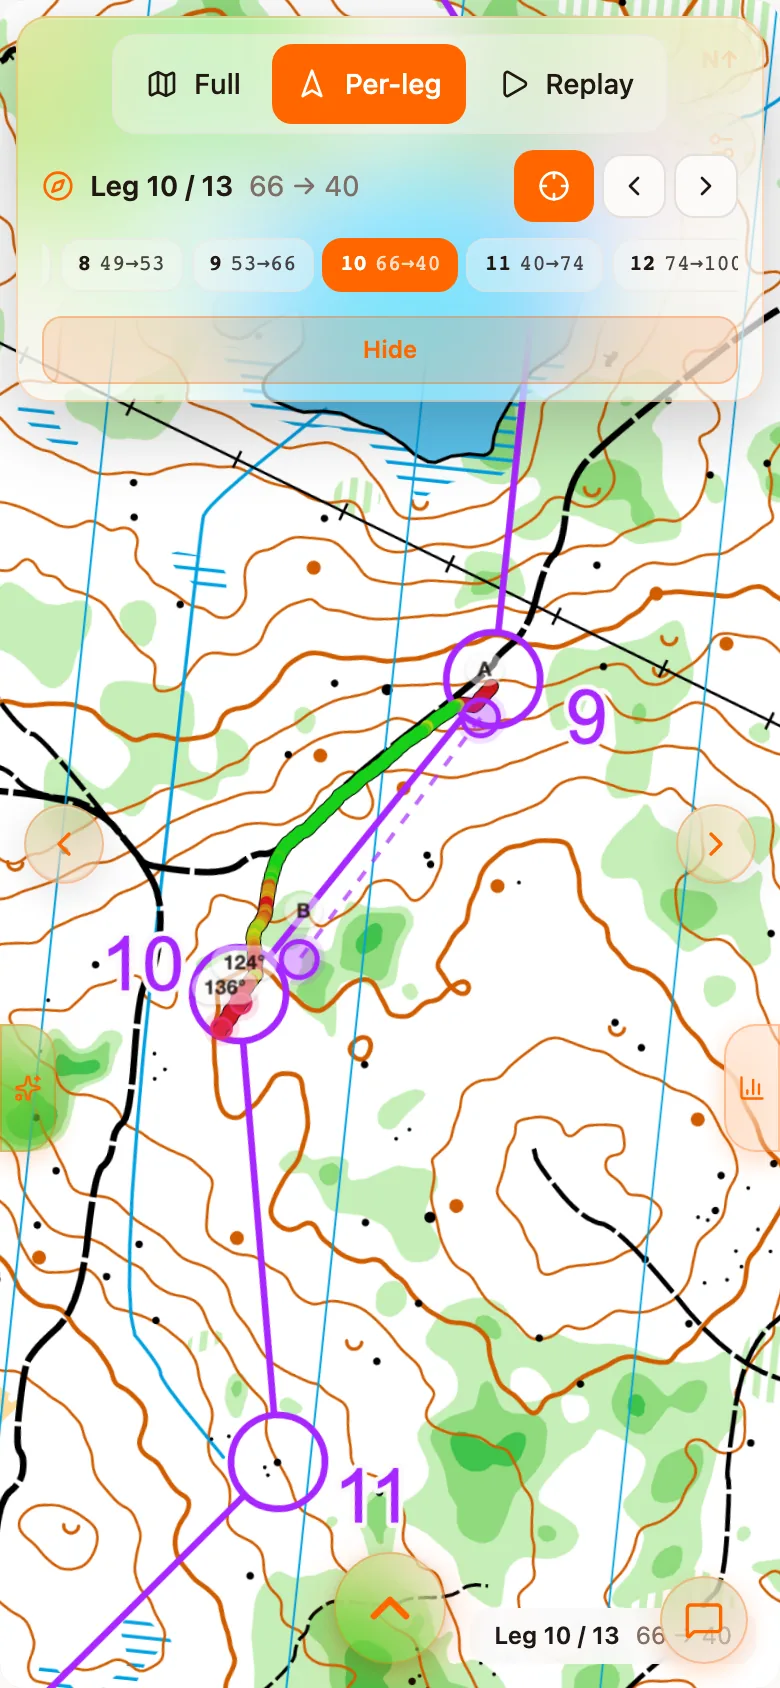
Per-leg slices your track at the controls and shows one leg at a time. It is where route choice is argued about, because it is the only view where two routes between the same pair of controls are drawn the same size, on the same map, turned the same way.
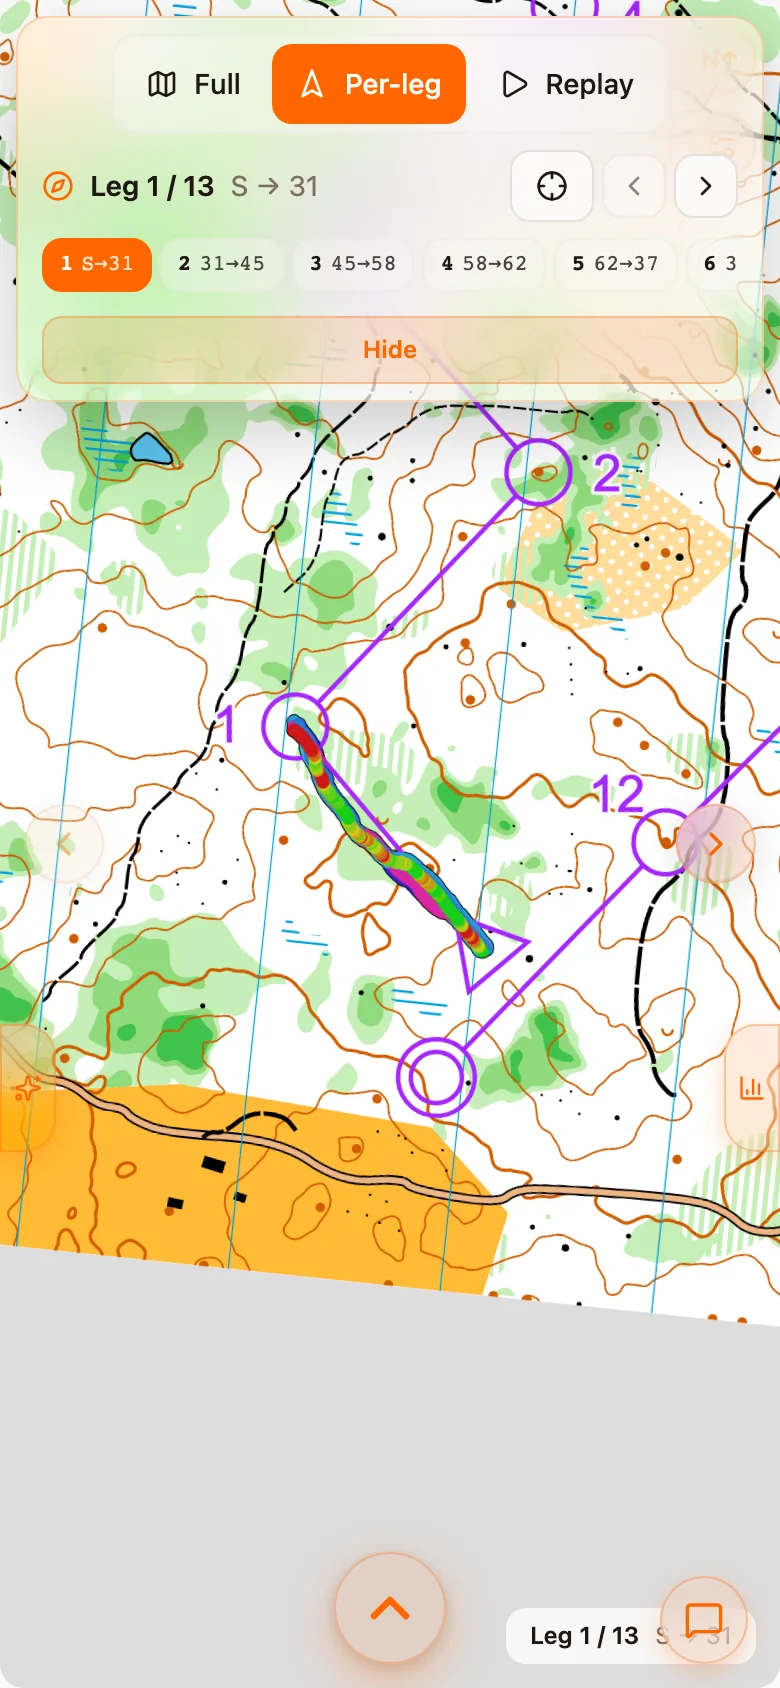
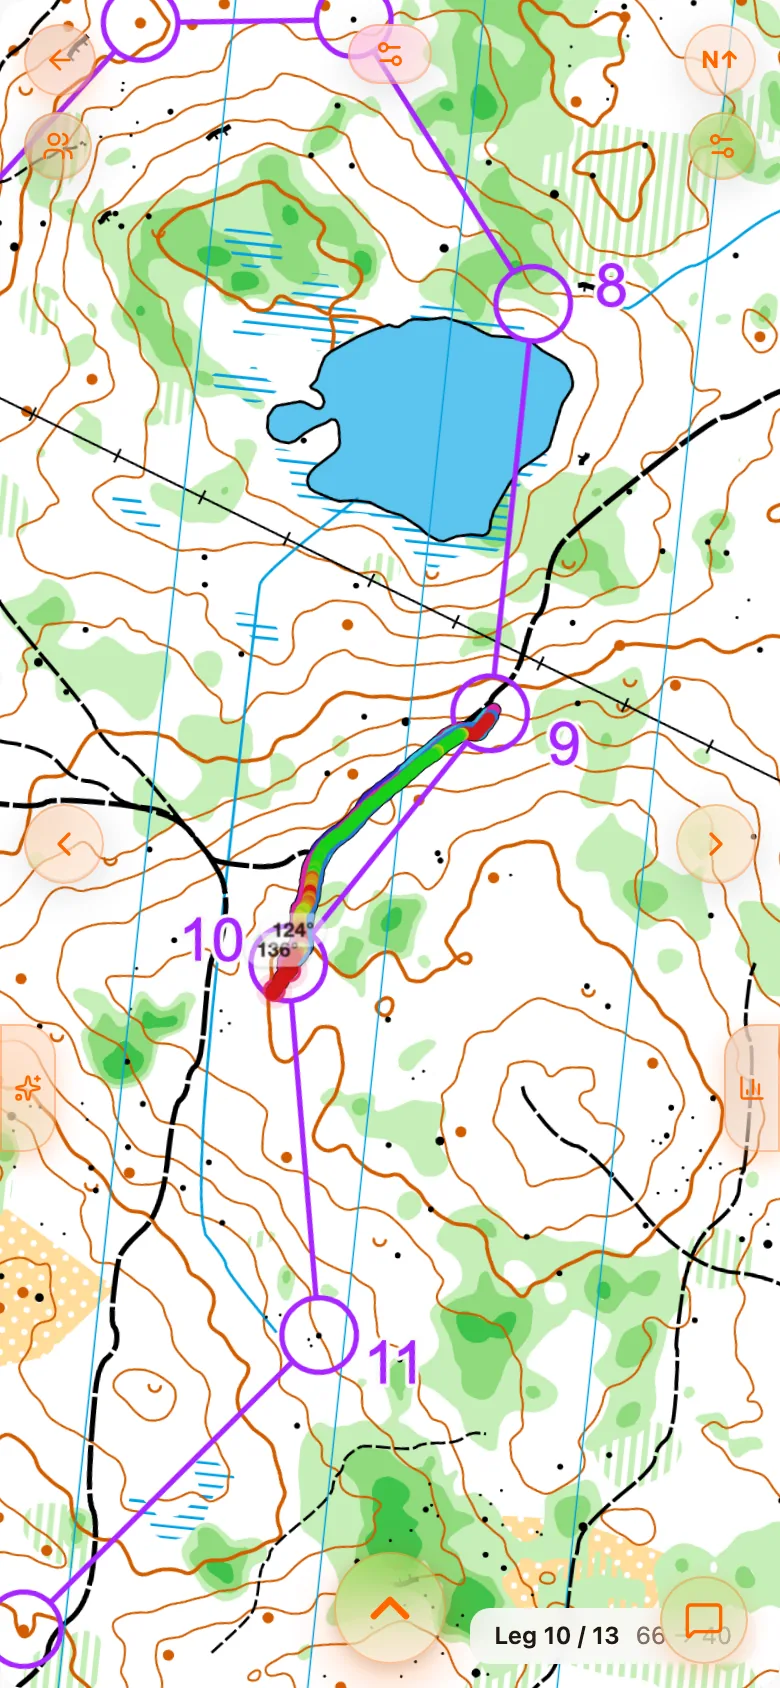
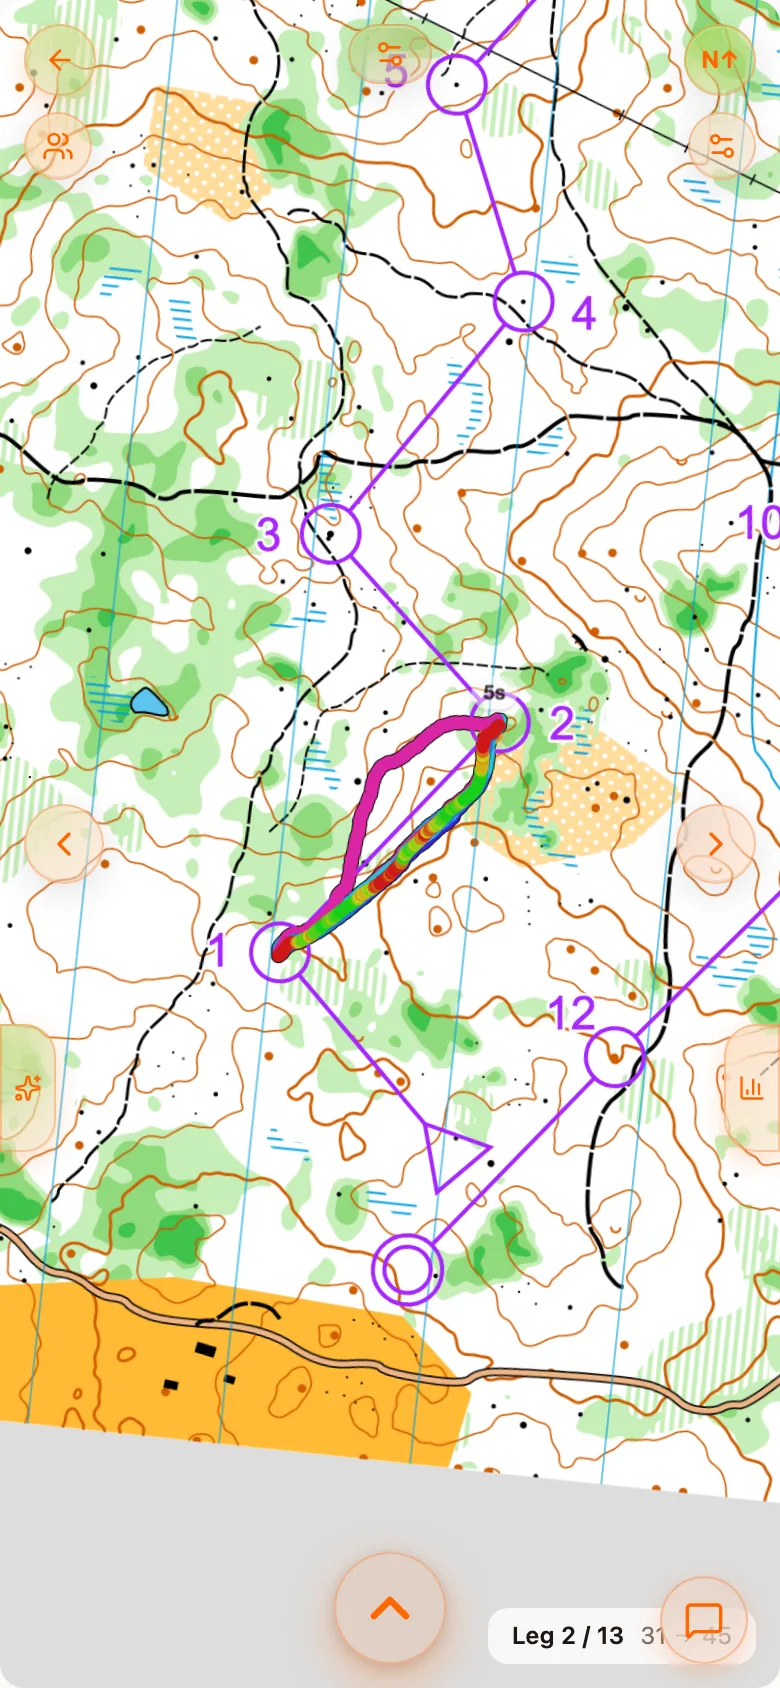
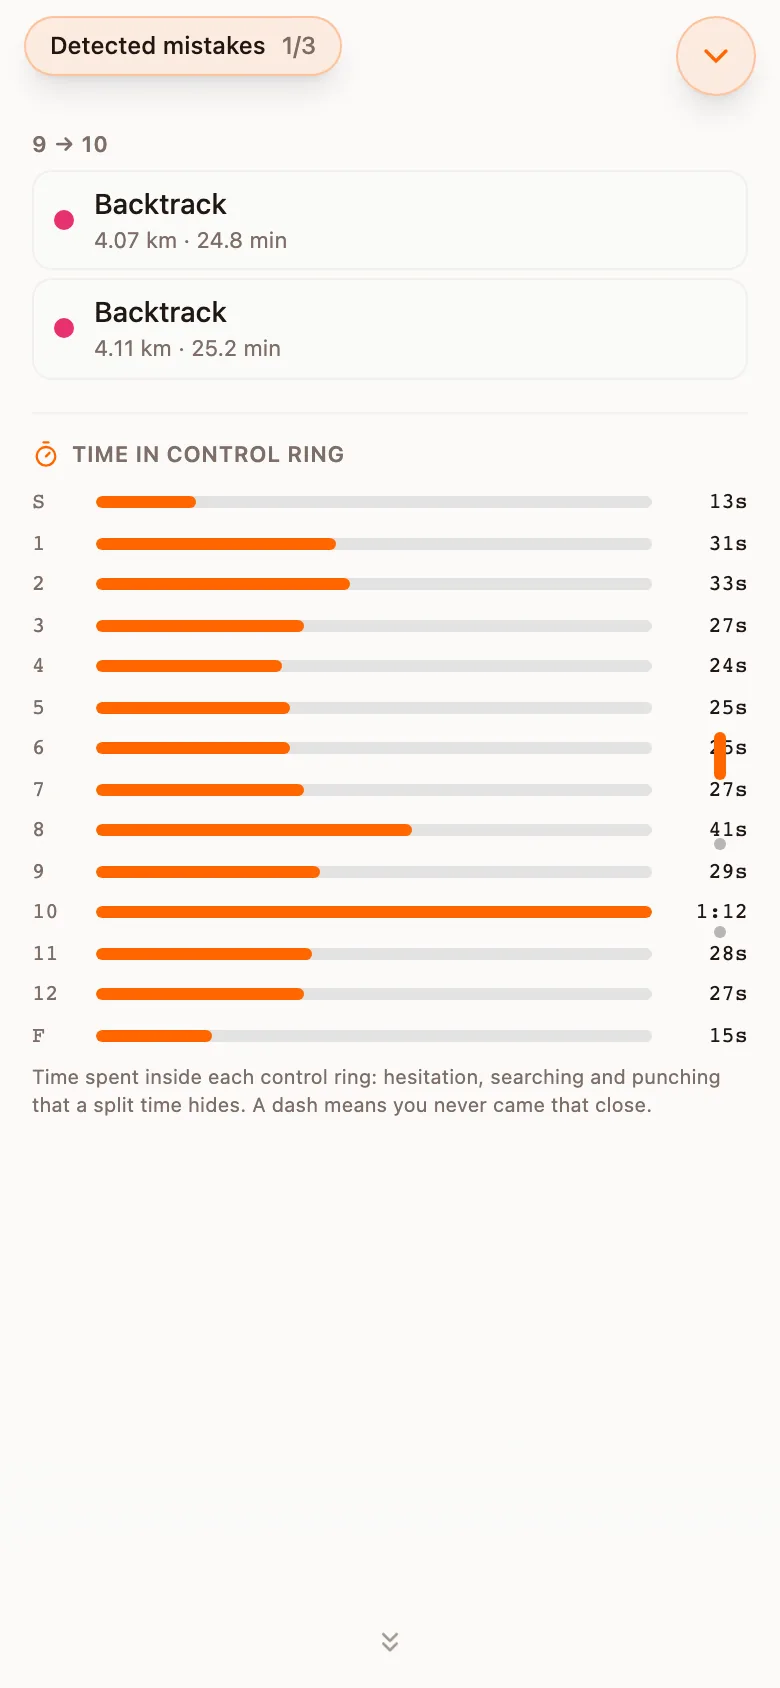
Moving between legs
Press Open toolbar and choose Per-leg. The toolbar shows which leg you are on, such as Leg 10 / 13, with the codes of its two controls, and a strip of every leg beneath it. Hide closes the toolbar and gives the map back; the leg stays.
| Control | What it does |
|---|---|
| The leg strip | A chip for every leg, numbered, with its two control codes. Tap one to go there. |
| Previous leg, Next leg | The arrows on the toolbar, and the larger arrows at the left and right edges of the map. |
| Rotate to leg | Turns the map back to the leg's own direction after you have turned it by hand. |
| Custom leg | The crosshair. Time any stretch of your own choosing (below). |
Tapping a mistake in the sheet, or a finding in the AI summary, also opens per-leg at that leg with the place marked.
Run-up rotation and zoom
In per-leg the map is turned so the leg points up the screen: you are always running upward, as you hold a map in the terrain. It is framed to the leg with the two controls at the edges. Both the rotation and the zoom are defaults you can set once in Settings and override per analysis.
Other runners on the leg
Press Open runners and pick who to draw: All, None, your Club, or the runners who finished Nearby you. Their tracks are drawn on the same leg, beneath yours. Two lines leaving the same circle and joining at the next, each with its time, is the most direct comparison the product offers. The list sorts by time or by distance.
Time your own stretch
A leg is not always the interesting unit. The Custom leg crosshair lets you pick two points on the map, A and B, and times exactly that stretch for you and for everyone who ran it, ranked. Custom legs are timed from GPS tracks, not from split times, so only runners who uploaded a track are in the ranking. Clear takes the points away.
The leg comparison table
The table sits in the sheet on a computer, and on a phone when the event has no split times. Each column can be switched on or off under Settings. The most useful one is Straight pace.
| Column | What it shows |
|---|---|
| Leg, # | The leg and the codes of its controls. |
| Dist | How far you ran on the leg. |
| Straight | The straight-line distance between the controls. |
| Time | Your time on the leg. |
| Pace | Your time over the distance you ran. |
| Straight pace | Your time over the straight-line distance. This one compares runners who chose differently: pace over your own distance rewards a longer route, since you covered more ground. |
| Climb, Descent | Metres up and down on the leg, where the file has elevation. |
| Mean dev | Mean deviation from the straight line between the controls. |
| Events | How many detected mistakes fall on the leg. |
| Field rank | Your place among the runners on the leg, such as 4/26. |
| Terrain mix | A bar of the kinds of ground the leg crossed. |
How a leg is found
Leg boundaries come from where your track passes each control. Where the event has split times, they correct the match: for each control the difference between the track's pass and the official split should be the same, and the median over all controls is used, so one bad match does not move the rest. That matters most for a runner who searched around a control, where the closest pass alone would put the boundary late.
Forked legs and merged splits
In a forked race, a split sheet often adds several course legs into one entry, because the runners did not all visit the same controls in between. Analyse maps the split legs onto the course legs and merges the course legs that one split covers into a single displayed leg. The same mapping is read by the leg comparison and by the AI coach.
Forking is declared, not inferred