
Layers, tiles and presentation maps
One event can carry several maps. Which kind you pick changes what runners see and what the analysis computes.
Every event has one primary map. That is the analytical source of truth: the georeference, the terrain classification, the passability model and the ISOM course overprint all read it and nothing else. Extra layers change what people look at; they never change what is computed.
Once you see that separation, the rest of this page makes sense. You can hide the primary map completely and the analysis still works, because none of the pipelines consult the layer list.
The three roles
| Role | What it is | How it is drawn |
|---|---|---|
| Overlay | A second georeferenced image on top of the primary map | Drawn over the primary at an opacity you choose |
| Presentation | A runner-facing rendition of the same terrain, for example contours only, paths hidden, or a scanned hand-drawn edition | Replaces the primary as the base map in analysis views; inherits the primary's georeference |
| Tile | One panel of a map that comes in several pieces, such as a page of a multi-page training PDF or one loop cut out of a sheet | Tiles from the same upload form a group and are shown in order |
Plan
Overlay layers
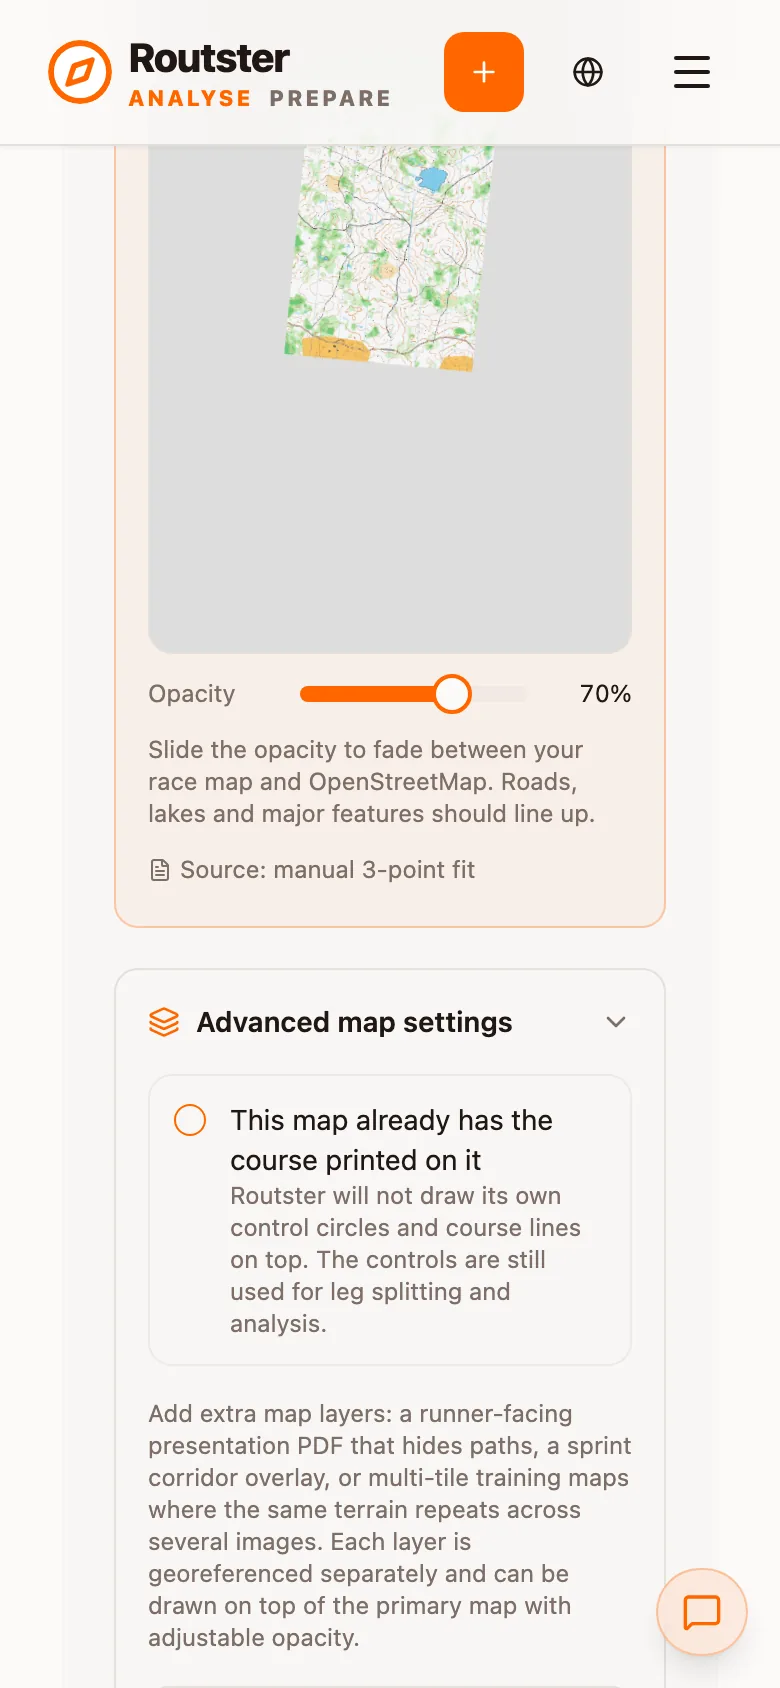
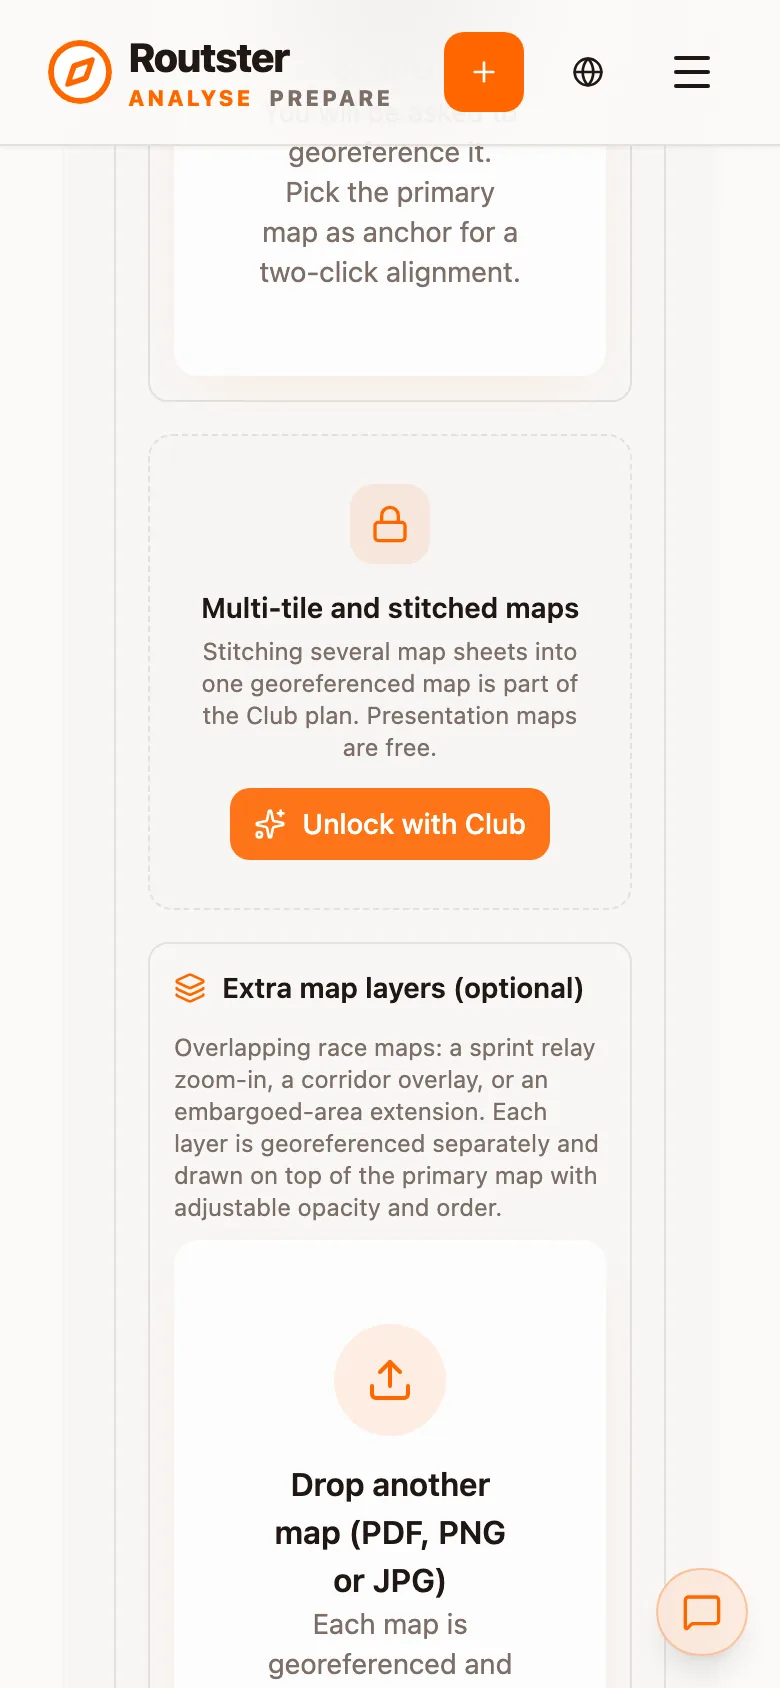
The simplest case: a second image over the first. Useful for an old edition of the map, a planner's sketch, or a satellite crop of a section people got lost in.
Each layer carries its own georeference and its own opacity. You can georeference it by:
- Dropping a world file (a
.wld,.jgw,.pgwor.tfw) beside the image. Instant and exact, when the projection is one we recognise. - Clicking matching points, the same feature on the layer and on the reference, three or four times. The transform is solved from them.
Whichever route you take, preview the result against the primary map or against satellite imagery before you move on. Layers are ordered, and the order is what decides which sits on top.
Presentation maps
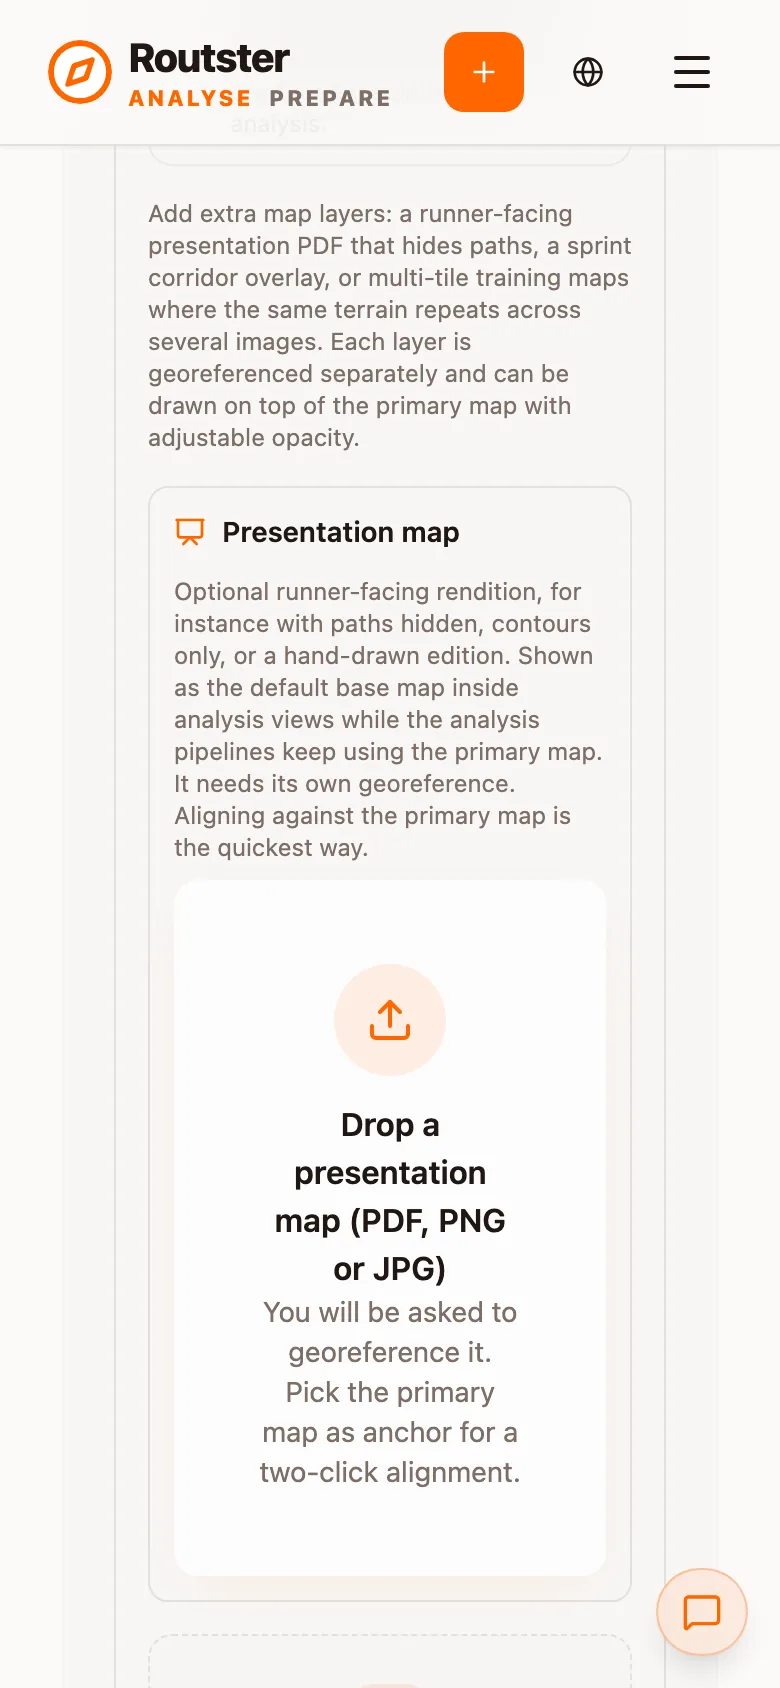
A presentation map is the map the runners actually held, when that is not the map the analysis needs. The classic case is a training where the OCAD render exists purely to serve the machinery (georeferencing, terrain, passability, the overprint), while the artefact people ran with was a PDF with the paths removed.
It inherits the primary map's georeference and dimensions, so there is nothing to align: the two are renditions of the same ground.
| Setting | Default | Description |
|---|---|---|
| Show only this map to viewers | Off | Removes the primary map from the layer switcher, so the presentation map is the only map on offer. The primary is still used for georeferencing, terrain analysis and the course overprint. This changes what is offered, not what is computed. |
| The course is already printed on this map | Off | Stops Routster drawing its own ISOM circles on top. The controls stay in the data, so splits, leg splitting and every analysis still work. Only the drawing is suppressed. |
The printed-course flag is per layer, not per event
Tiles
A tile group is one map that arrives in pieces. Two kinds of upload produce one:
| Split mode | Input | Result |
|---|---|---|
| One tile per PDF page | A multi-page PDF, or several images dropped together | Each page or image becomes a tile, in order |
| Regions on one sheet | A single page with several maps printed on it | You draw a rectangle or a circle around each one and each becomes a tile |
The second is the common case for a slingor training, where four or five loops are printed on one A3 sheet. Cropping each loop out gives the analysis a proper map per loop, which is what georeferencing, anchor alignment and terrain classification all want.
Keep the whole page
Cropping loses something, though: the sheet was arranged. Which loop is which, and where each sat on the page, is information a runner recognises and a bare crop throws away.
Keep the whole page stores the uncropped sheet alongside the tiles. Picking a loop then still shows only that loop's course, but drawn on the whole sheet with the rest faded, so the runner sees which loop it was and where it sat.
The sheet is uploaded once per group, not once per tile, and needs no georeference of its own: a crop is a pure translation of its sheet, so each tile's own transform is enough to place the sheet behind it. Storing it also costs nothing if you change your mind. The setting can be turned off later without re-uploading.
Georeferencing a tile group
This is where the real time goes, and there are two strategies:
| Mode | How it works | When to use it |
|---|---|---|
| Per tile | Georeference every tile individually against satellite imagery | Tiles covering genuinely different ground, or few enough that it is not worth the setup |
| Anchor to base | Georeference one tile properly, then align the rest by clicking the same feature on both images | Tiles cut from the same sheet or covering overlapping ground, which is nearly always |
Anchor alignment solves a similarity transform (uniform scale, rotation and translation) from your matched points, then composes it with the anchor's own pixel-to-world transform. Two matches are the minimum; three or four spread across the image are much better, because a pair clustered in one corner leaves the rotation poorly determined.
The anchor can be another tile or the primary map. Choosing the primary is usually right when it exists: it has the most trustworthy georeference in the event.
Do the anchor tile properly
Linking a tile to a class
A tile can be linked to a class by name. In a loop event that is what lets the viewer crop a runner's route to just that loop when the layer is active. Otherwise you would see the whole race drawn across a map of one loop.
Which map people actually see
For viewer-facing surfaces (event cards, the event page, the analysis base map), the map is picked in this order:
- The presentation map, if there is one
- Otherwise the first tile of the first tile group
- Otherwise the primary map
The primary map remains the analytical source of truth throughout. This order only decides which picture is shown.
Worked example: a slingor training
- Upload the OCAD file as the primary map. It georeferences itself and gives the terrain and passability pipelines something to read.
- Add the runner's A3 sheet as a tile group, split by regions on one sheet, with one region per loop.
- Turn on keep the whole page, so each loop is shown in its place on the sheet.
- Georeference with anchor to base: do the first loop against the primary map, then align the rest by matching features.
- Tick the course is already printed on this map on the tiles, since the loops came off the printer with their courses on them.
- Link each tile to its class, so routes are cropped to the right loop.
The result: runners see the sheet they held, with their own loop highlighted and their route on it, while every number in the analysis comes from the OCAD render underneath. See Georeferencing for how to check the alignment before you publish.